Libran "balance" can be very chaotic!
Week beginning September 30, 2013
We need to talk about The Spooky Stuff this weekend ... because there's a surprising amount of danger involved.
Copyright: Randall Ashbourne - 2011-2013
Libra is supposed to be one of the really nice signs of the zodiac. Symbolically, it represents a drive for equity, harmony, fairness, balance and diplomacy. Supposed to be. Sometimes, the velvet glove just puts a pretty face on the iron fist.
Which is precisely what we're seeing again as the Obama White House engages in another battle about debt with the Republican Congress.
Instead of playing nice with each other we see yet more nuances of the Uranus/Pluto square, which pits demands for radical reform against entrenched defence of the status quo. And, perhaps typical of Libra, both sides are on ... both sides.
Obama is determined to get radical reform of healthcare, while raising the debt ceiling to keep the Government functioning; Republicans want radical reform of spending and the scrapping of the healthcare reforms.
All that aside, past performance suggests the Sun travelling through Libra is nearly always a volatile time for the stock market.
The Sun is now travelling through Libra and will be joined by the Moon late this week for a New Moon, statistically a high point in market prices.
The New Moon is closely opposed to Uranus and square to Pluto, again setting off the tension we've discussed at length over the past 2 years.
The New Moon is closely opposed to Uranus and square to Pluto, again setting off the tension we've discussed at length over the past 2 years.


Safe trading - RA
(Disclaimer: This article is not advice or a recommendation to trade stocks; it is merely educational material.)
The chart below shows the performance of Wall Street's SP500 since the late 1990s, with the red bars depicting the Sun's annual move through Libra.
Libra is one of the Cardinal signs; an action sign. And it does tend to produce some very strong action ... and not much "balance".
There are 14 Libran Sun periods on the chart before the current one ... 9 of them produced significant lows, 2 produced significant highs. That's 11 of the 14 which turned the markets in a very significant way.
With odds like that, it's probably not a good time to nod off. Even the three periods which did not occur with a high or low produced a lot of action ... a strong rally in all three cases.
Now let's turn our attention to where we are in the bigger picture. Last weekend, I showed a monthly version of the following weekly channel chart and mentioned Big Bird on that chart was only just starting to show signs of negative divergence.
If we apply a general rule of normalcy ... and I emphasised just how normal that monthly chart was ... we cannot transform from Bull to Bear without clearcut divergence in the monthly Big Bird.
But, as I've said, weekly Big Bird has fallen off his perch and is squarking horribly. It's not screaming Bear! ... but it is giving increasingly shrill warning signs of another multi-week correction.
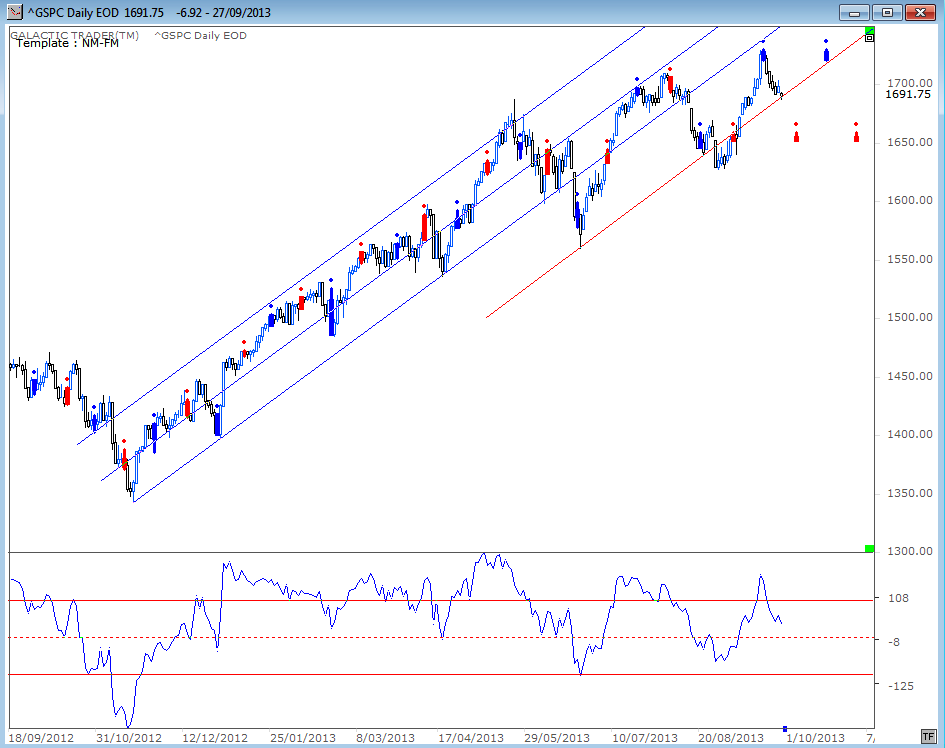
Our next chart is Pollyanna's New Moon/Full Moon chart. We discussed the implications of this channel last weekend because of the rarity of making a Full Moon price high.
New Moons are the thick red dotted bars (statistical high) and Full Moons are the thick blue bars. Check back through the performance and we can see it's unusual for the SP500 to drop directly into the New Moon. The tendency is to at least bounce for the few days into the NM date; Friday of this coming week.
New Moons are the thick red dotted bars (statistical high) and Full Moons are the thick blue bars. Check back through the performance and we can see it's unusual for the SP500 to drop directly into the New Moon. The tendency is to at least bounce for the few days into the NM date; Friday of this coming week.
Remember, too, that we have a Bradley Model trend change date next weekend. Check the Archives for last weekend's edition if you missed it.
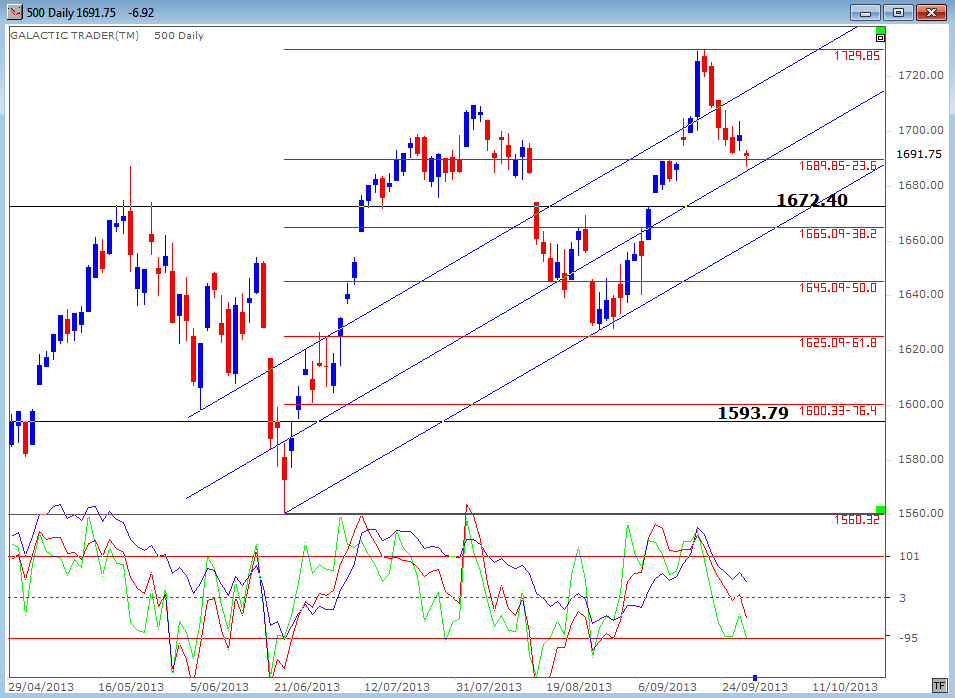
You'll notice on the New Moon chart that Polly closed Friday with another visit to the red parallel of the channel she'd been following for most of the year.
It was also a gap-filling, Fibonacci Retracement level of the post-June rally. I indicated early in the year I was starting to keep manual charts for Pollyanna because of the inaccuracy (total lies) of the official figures from the NYSE.
As you can see, the real Opening figures show she's been gapping all over the place for the past few months. While contact with a supportive FiboRx level and the rising trendlines indicates the potential to show a "normal" bounce into the New Moon on Friday (and the Bradley date), there are two very obvious gaps crying to be filled ... the black line at 1672.40 and another down at 1593.79.
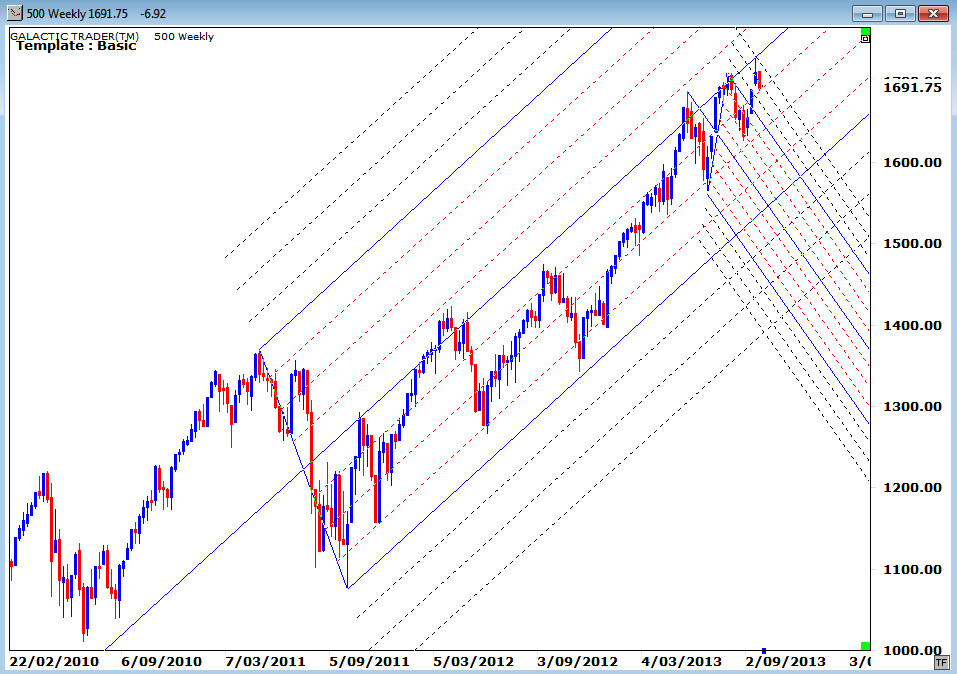
While the chart above uses the simple trendline/channel techniques outlined in The Technical Section of The Idiot & The Moon, we can also use Andrew's Pitchforks to get a good idea of where we are - and some sense of where we might be going.
The chart below shows both the long-range rising fork and the potential for more relatively near-term declines. Just "eyeball" the chart for the big picture overview.
The chart below shows both the long-range rising fork and the potential for more relatively near-term declines. Just "eyeball" the chart for the big picture overview.
So, what we seem to have is the potential for what would be a normal New Moon bounce this week. But we also have an intermediate-range Big Bird which is decidedly unhappy with the state of affairs and disagrees very, very strongly with the legitimacy of the recent price rises
We have a significant, month-long Bradley trend change indicated. And we have the potential for the Libran Sun to cause chaos and sharp price moves. Caution, anyone?
We have a significant, month-long Bradley trend change indicated. And we have the potential for the Libran Sun to cause chaos and sharp price moves. Caution, anyone?
Because once we see the broad picture, it's easier to spot exactly where we are within the broader context.
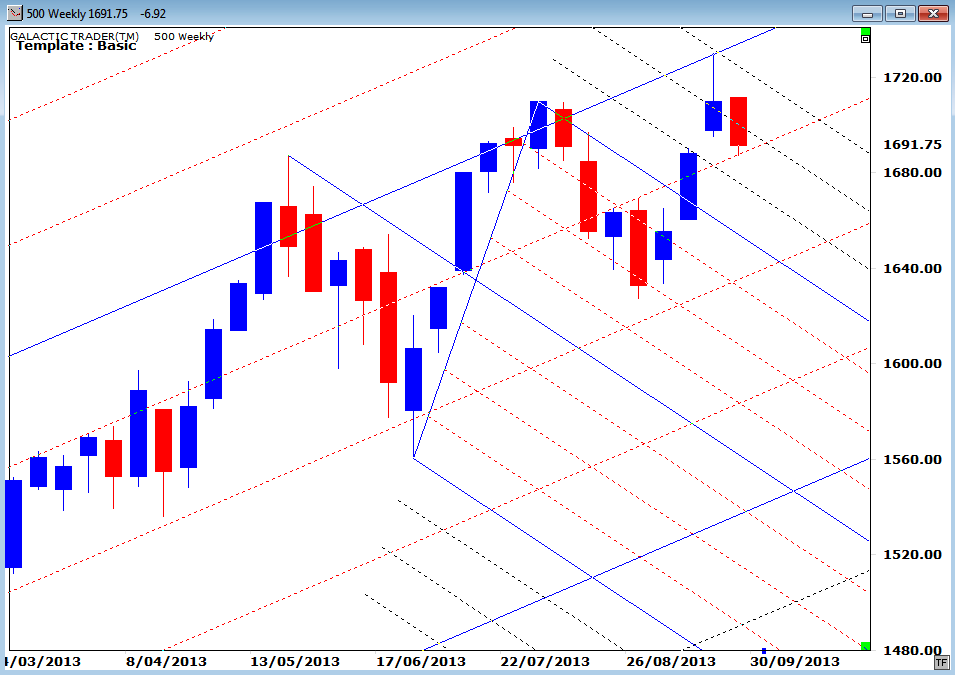
We can see Miss Polly topped out two weeks ago with a touch of the central blue tyne of the rising, long-range fork. It was also the place where the last Fibonacci outlier of the falling fork came into play.
We don't really need ALL of these methods. Too many cooks spoil the broth; too many charts befuddle the brain. Still, we see Polly ended the week with a touch of one of the important internal Fibonacci lines of the rising fork.


