
Ben down, Mario to come
Week beginning September 3, 2012
Like addicts slobbering for their next fix, markets got a pop from a new dose of Ben-zedrine ... and now wait for a Super Mario stimulus shot later this coming week.
Copyright: Randall Ashbourne - 2011-2012
Apparently, it's all the fault of the Commie Yellow Peril who - gasp*shock*horror - SAVED their money. You can find the full article here - http://www.cnbc.com/id/48814165 - and you might be shocked to know the fool, Greenspan, had nothing to do with low interest rates. All America's problems were caused by coolies who, after centuries of being ruled by mad despots, had the temerity to want some safety for the money they were beginning to accumulate.
As usual, there's a heavy Teflon gloss slopped across the criminal behaviour of the banks and a whole new meaning applied to The Butterfly Effect, when opening a savings account in Shanghai sends Wall Street into a death dive.
I await patiently new USA think tank reports blaming actual Chinese butterflies for flooding Nawlins, as part of some evil Politburo plan to disrupt oil production in the Gulf.
There's something not quite right about free market capitalists constantly begging for government bail-outs to prop-up their stocks.
It's almost, but not quite, as weird as the academic report which surfaced in the USA late last week blaming the Chinese for the 2008 crash.
It's almost, but not quite, as weird as the academic report which surfaced in the USA late last week blaming the Chinese for the 2008 crash.


Safe trading - RA
(Disclaimer: This article is not advice or a recommendation to trade stocks; it is merely educational material.)
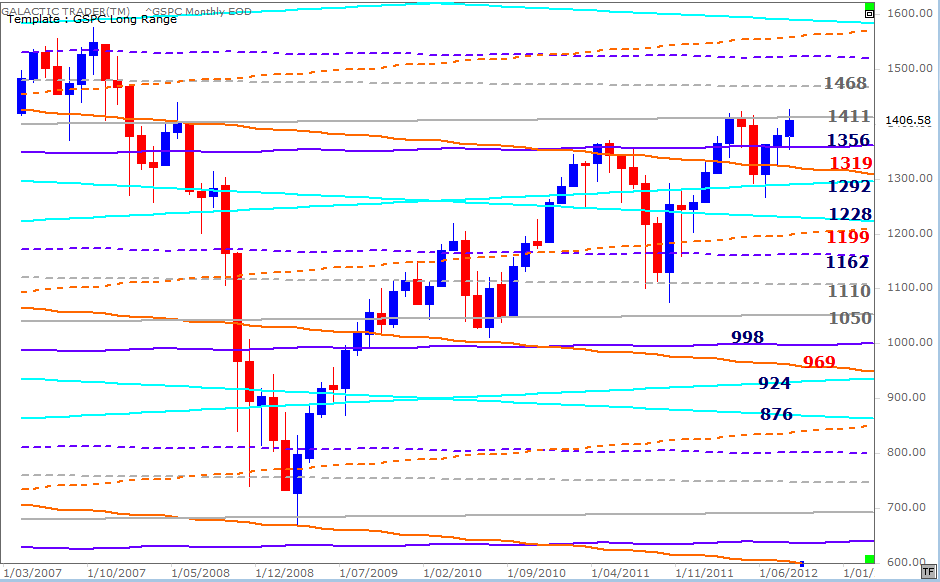
The chart above is Pollyanna's long-range planetary chart, with price rises continuing to be capped by the Neptune line around 1411.
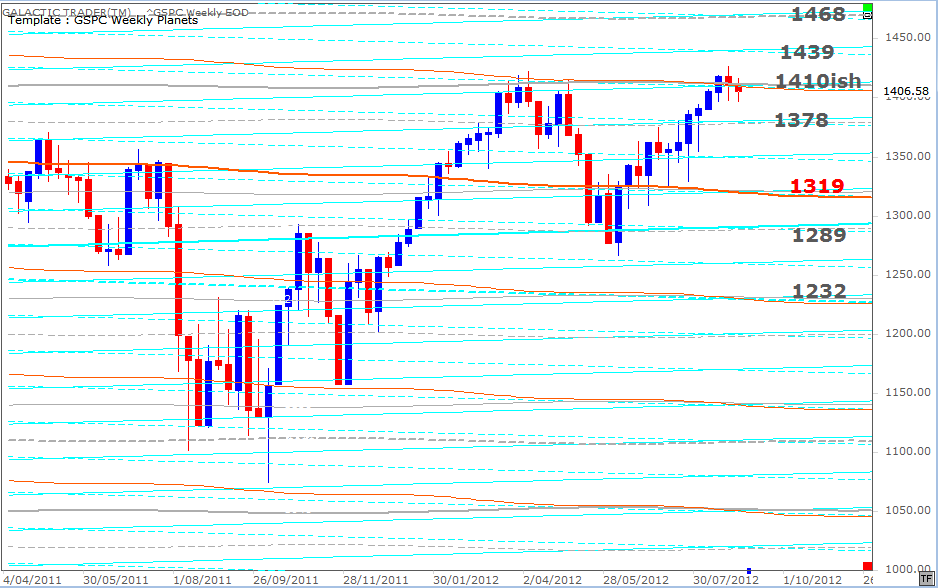
And, below, is Polly's Weekly Planets chart, showing a tighter combination of planetary barriers at that level, as well as the intermediate targets for breakout or breakdown.
And, below, is Polly's Weekly Planets chart, showing a tighter combination of planetary barriers at that level, as well as the intermediate targets for breakout or breakdown.
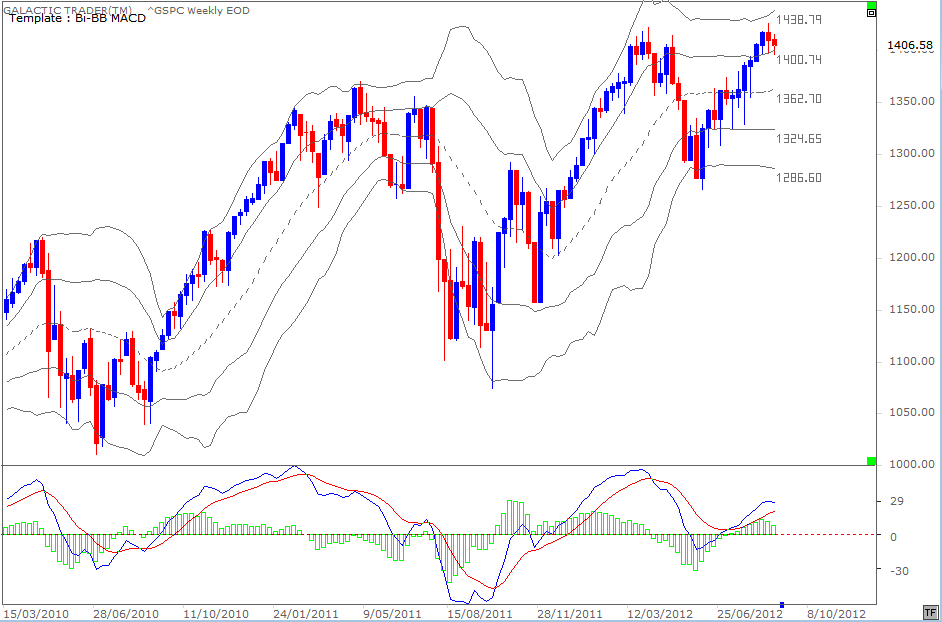
The index's weekly Bi-BB chart shows price continues to hold within the upper tier, though it is maintaining the position with significantly decreasing support from the fast MACD, especially the histogram peaks which have been falling away since the bounceback a year ago.
Okay. August is gone and we enter September, historically the worst month for Wall Street. The trading month begins there with markets closed for Labor Day as everyone enjoys the end of the Summer holiday season ... still digesting Ben's blabbering and waiting to see if the two Roman Marios can overturn the last couple of thousand years and score a win over Germania.
The Spooky Stuff is picking up again and there are some astrological aspects in the coming week which have a track record of turning markets - Venus square Saturn on Monday and the Sun square Jupiter on Friday.
Let's look at some charts.
Now, as an homage to the actor who used to make movies with an orangutan and who backed Romney last week, we could call this one: The Do Yuh Feel Lucky, Punk? chart ...
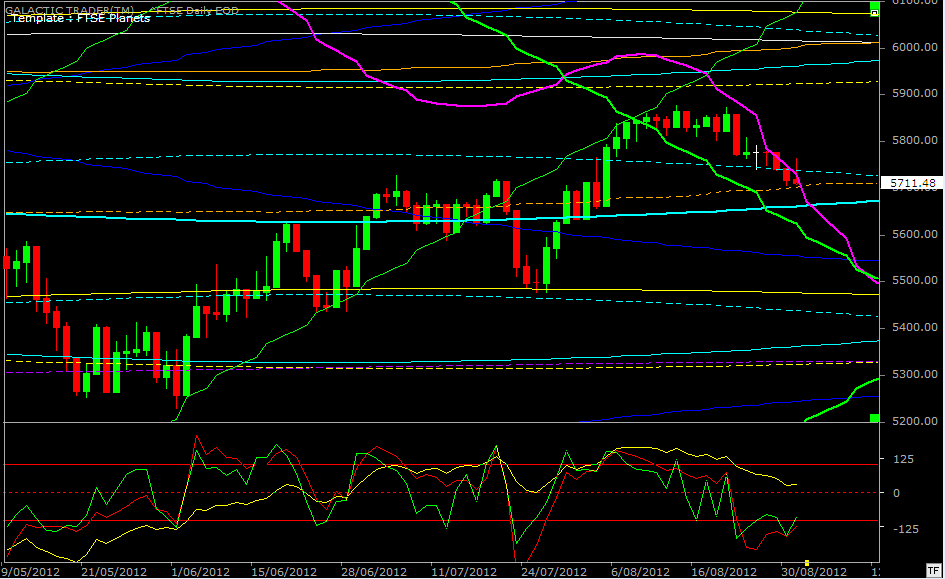
We were alterted a couple of weekends ago to the potential for a decline, when I pointed out London's FTSE was about to run into a downtrending Sun/Mercury planetary influence which had caused drops in the past.
Well, do yuh? This is the SP500's long-range Monthly. I find it hard to believe even Alan Greenspan would be looking to "stimulate" stock markets with prices at current levels. Still, we need to be wary. After all, there's a chance Apple factory workers will stop killing themselves and open savings accounts.
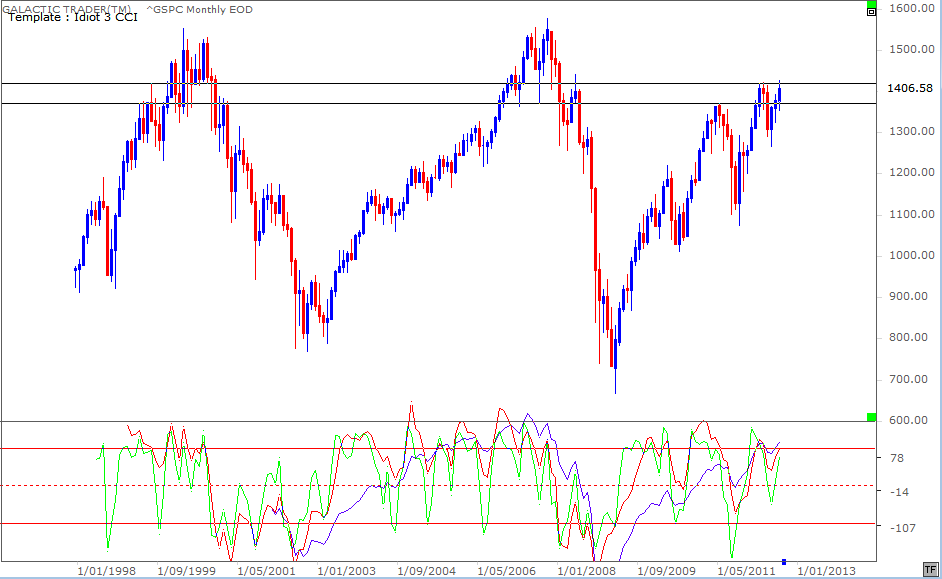
The marginal new Highs for August did not find support from the short and medium-term oscillators (green and red). However, while the long-range Canary has started rolling over on weekly charts, pointing to the risk of an intermediate decline underway, there is no clear negative divergence signal yet from the long-range Canary.
The marginal new Highs for August did not find support from the short and medium-term oscillators (green and red). However, while the long-range Canary has started rolling over on weekly charts, pointing to the risk of an intermediate decline underway, there is no clear negative divergence signal yet from the long-range Canary.
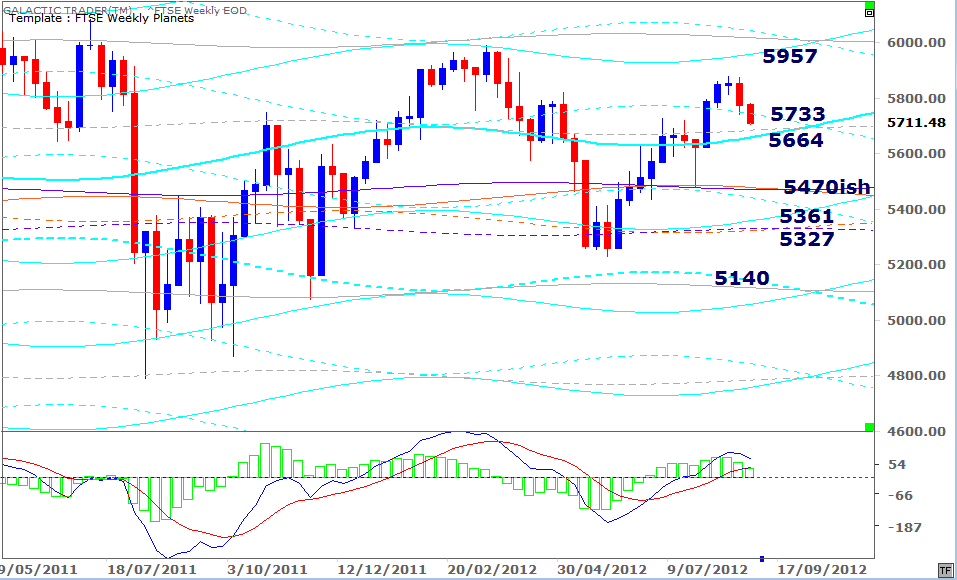
So far, the price of the FTSE has been following the expected route. The index would need a hard-down day on Monday to stay strongly under that influence. That seems an unlikely outcome, unless something untoward happens over the weekend. There is some mild positive divergence in the short and medium-term oscillators (green and red) - and the FTSE is at a Node level which acted as Resistance in July and has some potential now to turn into at least temporary Support.
The FTSE Weekly Planets chart, showing the price targets, is below.
The FTSE Weekly Planets chart, showing the price targets, is below.
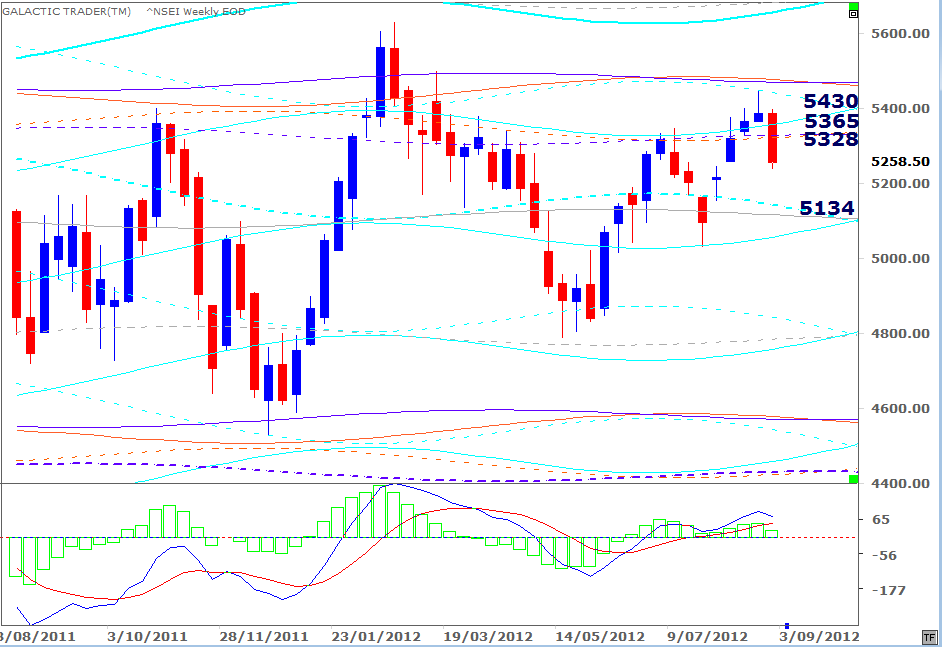
India's Nifty 50 is the next chart, below.
And our final chart for this weekend is for the ASX200 and is one from my private set of charts I haven't shown you before. I have shown you charts in the past indicating the ASX tends to be a Neptunian index for long-range moves, with some influence from Uranus ... they're the grey and yellow horizontals on the chart below.
The red lines are Mars. Like Pollyanna, Auntie tends to travel between Uranus/Neptune outposts within Martian channels. It's entirely possible to draw these charts with simple, technical Support and Resistance lines ... and using trendlines to replace the Marshuns.
The red lines are Mars. Like Pollyanna, Auntie tends to travel between Uranus/Neptune outposts within Martian channels. It's entirely possible to draw these charts with simple, technical Support and Resistance lines ... and using trendlines to replace the Marshuns.
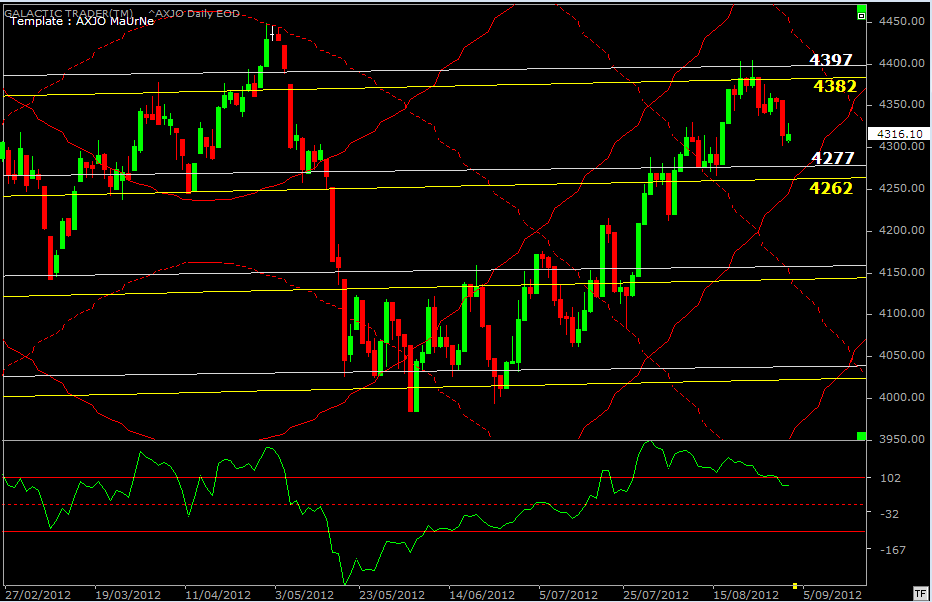
As y'can see, the index has a track record of stopping-and-turning, or at least stalling, when it runs into this particular set of planetary lines. For the week ahead, we can see there'll be a triple effect in play around 4400 on the topside ... and probably not a lot further to drop before Support comes into play.
As we all wait to see if Draghi can make the Bundesbank blink.
As we all wait to see if Draghi can make the Bundesbank blink.
