
USA, India, Hong Kong reach Resistance
Week beginning September 1, 2014
Wall Street will be closed on Monday, but the shortened week to follow is likely to be volatile.
Copyright: Randall Ashbourne - 2011-2014
And that now leaves them vulnerable. It was a week I'd indicated was likely to be important because of the Mars conjunction with Saturn being squared simultaneously by Venus.
It was the Old God of War meeting the Old God of Borders ... and the Queen of Material Values having a hissy fit over their interaction.
Reportedly, Russian artillery crossed into Ukraine. As I said in the August 18 edition: "Mars, in Scorpio clothing, is heading for a conjunction with Saturn. This won't be pretty. Think ... Cesare Borgia and the "charm" of a King Cobra off for a little chat with the King of Naples. Soon to be the dead, former King."
There was no Eye of Ra last weekend and for many markets last week was a narrow-range, do-nothing show.
It was a week I indicated in the August 18 edition that markets had to crash through ... or face the prospect of a crash.
They didn't crash through.
It was a week I indicated in the August 18 edition that markets had to crash through ... or face the prospect of a crash.
They didn't crash through.


Safe trading - RA
(Disclaimer: This article is not advice or a recommendation to trade stocks; it is merely educational material.)
And I suspect this could all get double-plus unpretty very fast. Mars in Scorpio is not the brash, upfront Arien version of the Old God; it's the fight-to-the-death version ... secretive, silent, and extremely toxic. Mars now enters the last third of Scorpio ... the nasty bit with the deadly stinger in the tail.
You know the one from the old tale ... the bit that made it foolish for the frog to play at being the ferryman.
We also discussed in the last edition the Sun opposition to Neptune, which happened last Friday. And that alone is a danger sign.
You know the one from the old tale ... the bit that made it foolish for the frog to play at being the ferryman.
We also discussed in the last edition the Sun opposition to Neptune, which happened last Friday. And that alone is a danger sign.
And here's why. We've discussed in the past why astrological aspects between planets sometimes impact upon markets exactly as "expected" and at other times don't work at all.
I've explained that price must meet the planet crossing point precisely in time and space.
Well, with the SP500 it did exactly that on Friday.
The chart on the left shows a declining, dotted green line crossing below a dotted grey horizontal. That's the falling Sun line opposing Neptune.
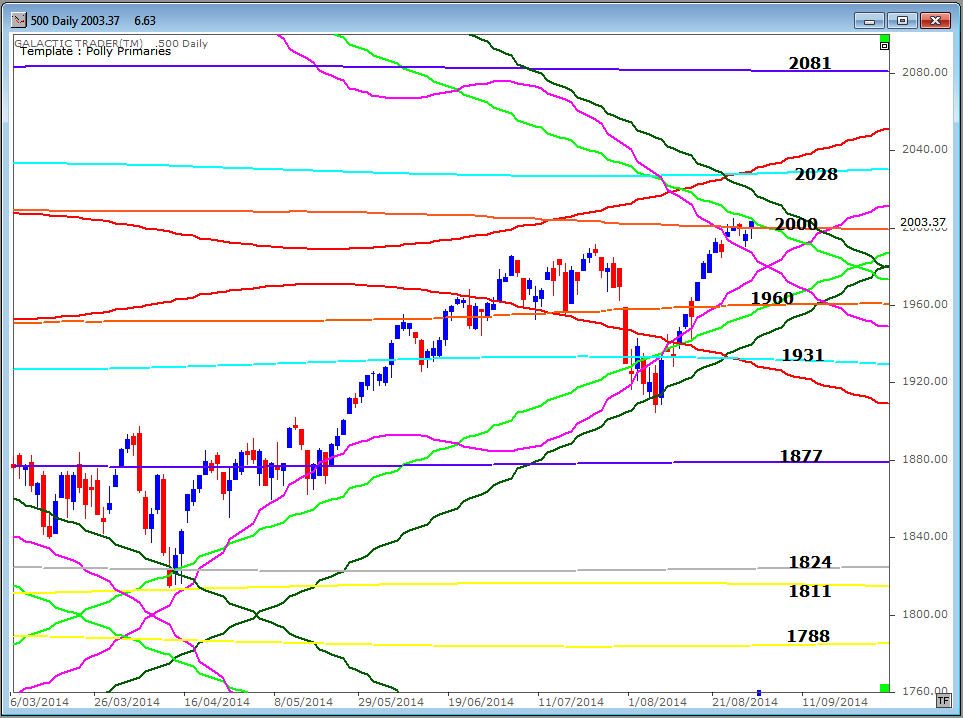
So, when Wall Street opens on Tuesday, the big boys' computers are going to have to force a gap above $2004 ... or the index will be in danger of starting a dive.
And it's now not the only major world index hitting its head against major overhead planetary price resistance.
In the next few charts, we'll look at both the near-term and long-range planet prices for Pollyanna, the 500 ... and at the Hang Seng and Nifty.
The potential danger is even more obvious when we examine the long-range monthly chart below. These Node price zones have a long history of changing the trend, or at least stalling it significantly.
India's Nifty has now hit major planetary resistance.
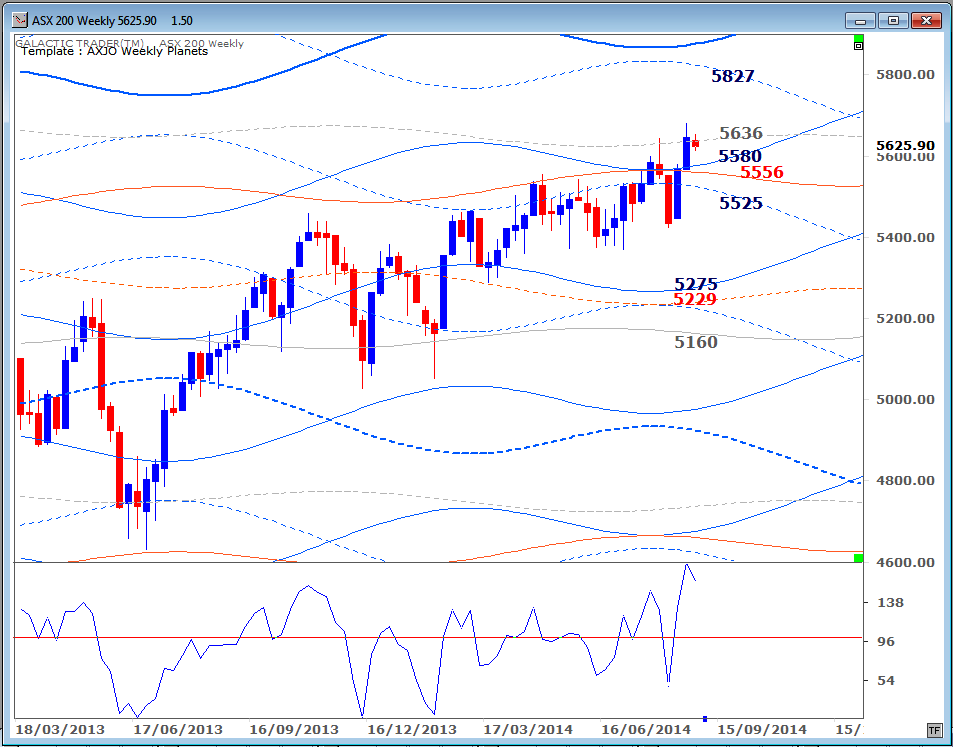
The Australian stock market went nowhere last week. Below is the ASX200 Weekly Planets chart I'm sure you're all now thoroughly familiar with.
Its daily chart is not dissimilar to Pollyanna's ... price is already dropping under the influence of a falling primary Sun line.
Its daily chart is not dissimilar to Pollyanna's ... price is already dropping under the influence of a falling primary Sun line.
And Hong Kong has made it back to a zone it has been struggling to regain for the past three years ... and faces another major hurdle not far north of that one, if it makes it through.
The one potential bright spot in the AWP chart above is that the Big Bird oscillator wasn't at all unhappy with the new price high. That's not the case with the same oscillator on monthly charts, but it's just enough to make me think the ASX has enough internal impetus below the surface to make another breakout attempt ... if not immediately, then after the next correction downwards.
Gold. Same-old, same-old. The central banks continue their games in the paper markets; the Chinese keeping buying every single gram of the physical stuff they can get their hands on; the Lows from earlier in the year continue to hold and my personal leaning remains that gold prices are now within the early uplegs of a new Bull run.
Gold. Same-old, same-old. The central banks continue their games in the paper markets; the Chinese keeping buying every single gram of the physical stuff they can get their hands on; the Lows from earlier in the year continue to hold and my personal leaning remains that gold prices are now within the early uplegs of a new Bull run.

The chart below shows only the primary planet lines for Pollyanna. We've discussed in the past the importance of this Node range, now priced at 1960 and about 2000.
Having lifted from earlier in the year on rising primary lines, the index is now facing downward pressure from falling primary lines, with the green Sun line having been very important to the uptrend and now, potentially, another correction downwards.
Having lifted from earlier in the year on rising primary lines, the index is now facing downward pressure from falling primary lines, with the green Sun line having been very important to the uptrend and now, potentially, another correction downwards.


