
A heightened sense of danger
Week beginning October 22, 2012
While key DNA markers normally obvious at The Top are still missing in some Western stock indices, I'm getting the sense those markets have suddenly become dangerous.
Copyright: Randall Ashbourne - 2011-2012
And the reason we've constantly looked at that possibility is the lack of a negative divergence signal from the long-range Canary on Pollyanna's monthly charts.
A few editions ago, I pointed out that key divergence signal had started to become very obvious in the Nasdaq 100, the NDX. It may now also be starting to show in the Dow Jones Industrials.
In both of those indices, the heavy-lifting over the past couple of years has been carried on the shoulders of very few stocks ... like Caterpillar and Apple.
We will take a close look this weekend at the alarm bells going off in the NDX and the general state of some other major indices.
For the past 6 weeks, the broad-based Wall Street index, the SP500, has been stuck below the 1468 level marked as a key barrier on my long-range Old Gods chart.
We've remained open to the possibility of a breakout to new highs at 1522, or even a blow-off to around the 1560 level.
We've remained open to the possibility of a breakout to new highs at 1522, or even a blow-off to around the 1560 level.


Safe trading - RA
(Disclaimer: This article is not advice or a recommendation to trade stocks; it is merely educational material.)
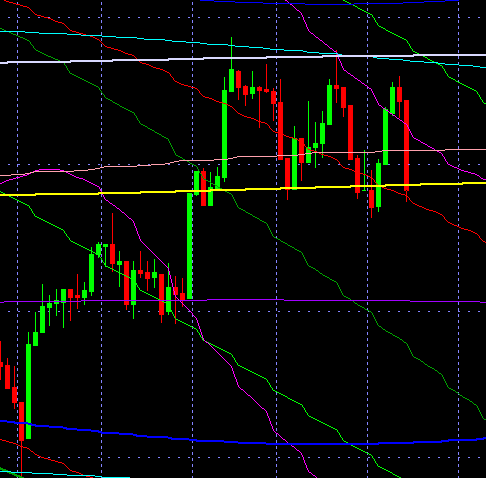
I said: "And the key to direction will be how price performs on both Monday and Tuesday. On the chart to the right, note the intersection of the falling red Mars line with the thick yellow Uranus line.
It's at 1434. Pollyanna must close decisively above this level on Monday to re-enter rally mode. She gets a second chance at an astro energy boost on Tuesday, if she fails the 1434 Monday test.
In the chart above, the Venus square Jupiter price crossing point (rising green intersection with horizontal blue) is 1426.
So there are two things to watch for ... a Monday close above 1434, or a Tuesday low at 1426, from which price bounces."
We can see what happened in the chart on the right - and there was no need to wait for Tuesday.
Because, on Monday, Miss Polly did make a decisive close above the 1434 level and re-entered rally mode for most of the week.
But with the Moon in a Sagittarian-exaggerated fear mode, Friday's freefall wiped out almost all of the gains.
Now, maybe it's just a one-off, one-day comeback for Chicken Little.
But, what if it's not?
Firstly, let's remind ourselves of where the Pollyanna index is in terms of its long-range planetary price markers.
Normally, I refuse to be jerked around by one day's movement in any index. But, I'm getting a sense that something fundamental has changed following Friday's performance on Wall Street.
It's true the drop happened with the Moon in Sagittarius and I said last weekend: "Mars is now in Sagittarius and it'll be joined by the Moon later in the week. Sagittarius has a tendency to exaggerate either the optimism ... or the fear. And wide-range days are the norm when the Moon is in Sadge."
So, even though we did get a wide-range fear day down, I still can't shake the sense there has been a change at a deeper level. The week began for Miss Pollyanna pretty much in accordance with my expectations. I outlined two important scenarios for Miss Polly on Monday, or Tuesday, which would prompt a price bounceback.
There is nothing out of the ordinary in the chart above. Well, apart from the fact the support and resistance lines happen to be determined by the position of a few rocks and giant gas balls Out There.
But, from a technical viewpoint, it still all looks hunky dory. Here we are two-thirds of the way through October and price is still largely within the spike part of September's range.
But, if you look at it on a weekly, it has been 6 weeks below the peak of that spike. That suggests it's either accumulation ... or distribution. In other words, the Big Boys have been slowly stocking up for another rally ... or they've been unloading hand-over-fist to anyone who believed Goldman's "buy, buy, buy" memo.
In the meantime, the NDX has been screaming "danger, danger, danger".
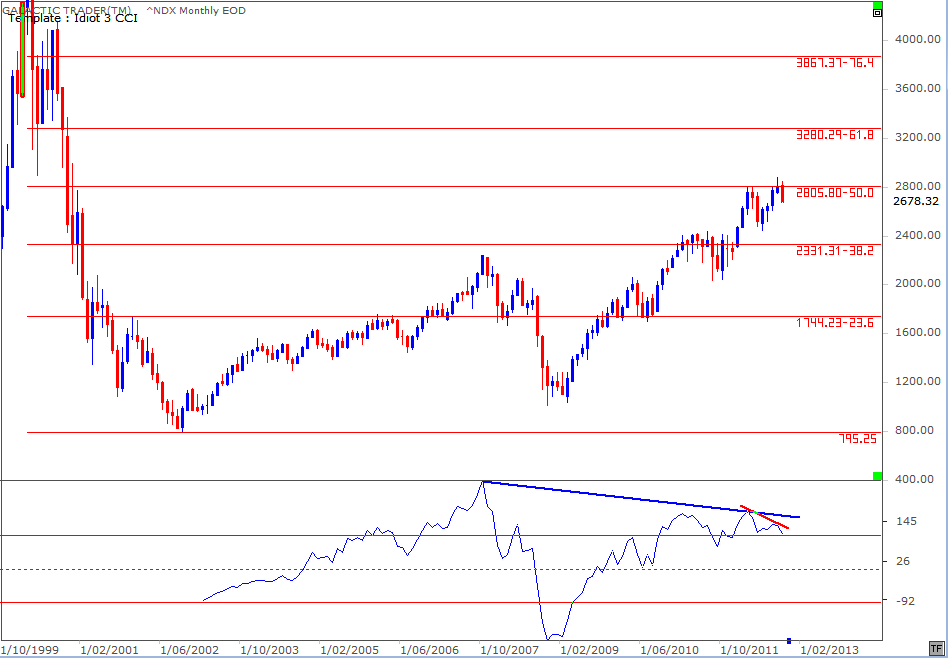
We've discussed the importance of 50% Fibonacci Retracement levels in the past and noted the danger it posed on the NDX. We now have quite severe negative divergence between the long-range Canary peak in March and the much lower peak it posted last month when price briefly broke above the 50% FiboRx level.
But the divergence is more dangerous when we look at the peak the Canary made in 2007 and its performance since the 2009 bottom.
As y'know, in terms of astrological predictions, I expected markets to top out in March and go into freefall until at least October. So, these days I don't go out much because that much egg on your face isn't a good look in public.
In spite of that, the apparent failure of the long-range Jupiter-in-Taurus top is beginning to look more like a regional variation on the theme, rather than a broken signal.
Here's another look at the NDX monthly, with the dark green bars showing the periods of Jupiter in the sign of Taurus. On the left of the chart, we can see the Nasdaq's blow-off, all-time high. As Jupiter entered Taurus, the market launched into the heavens.
We then got a secondary peak with Jupiter in early Gemini ... 3 monthly bars past the last green Jupiter bar.
And now ...
Yes, it's starting to look disturbingly familiar ... a marginal new peak 3 bars past the last of the Taurean Jupiter bars.
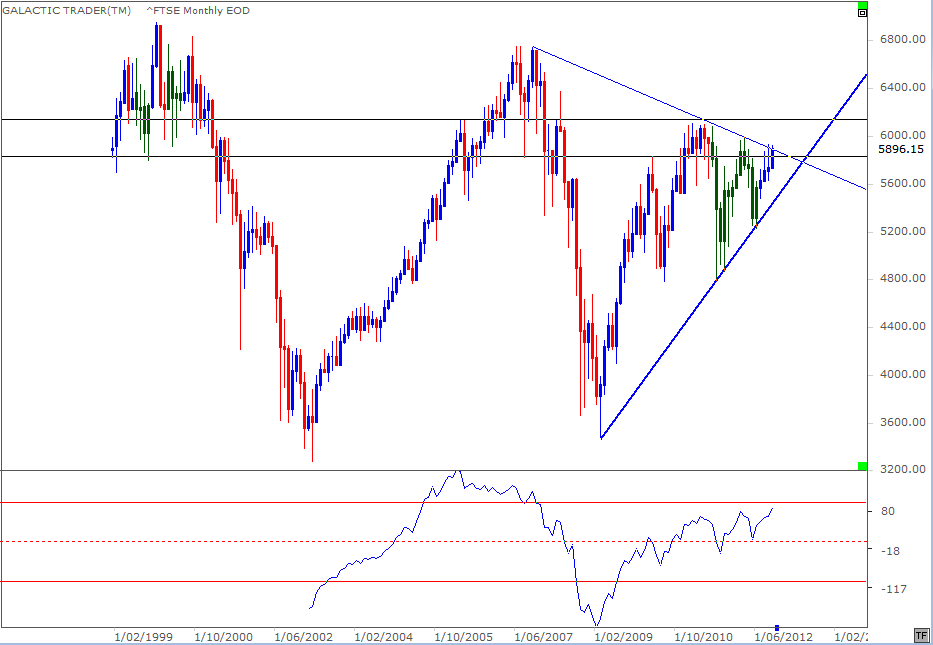
And London's FTSE index lends support to the NDX signals. There, the post-June rally has still not taken out the Taurean Jupiter high of March, nor the 2011 rally peaks.


So, we seem to have arrived at an interesting place ... and the question is whether the American Presidential cycle, whose 4Q performance I touched on last weekend, has actually displaced the Jupiter-in-Taurus signature, or has merely temporarily delayed its onset.
It's a vitally important question because if it's the latter scenario, we may already have seen The Top. There's no surefire confirmation yet; Bernanke and Draghi may yet drop more make-believe moneybags into the path of the tsunami.
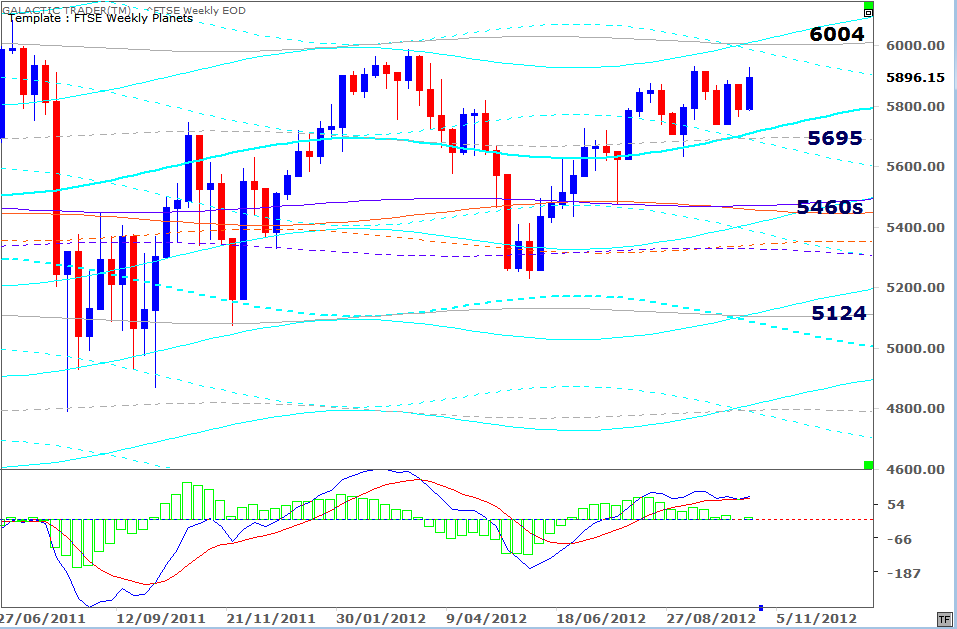
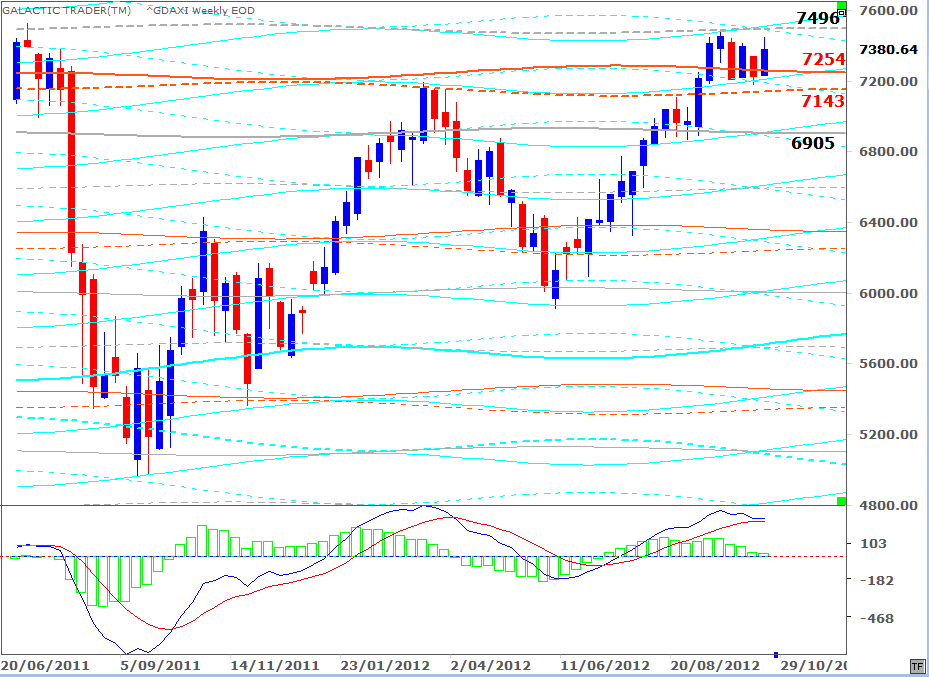
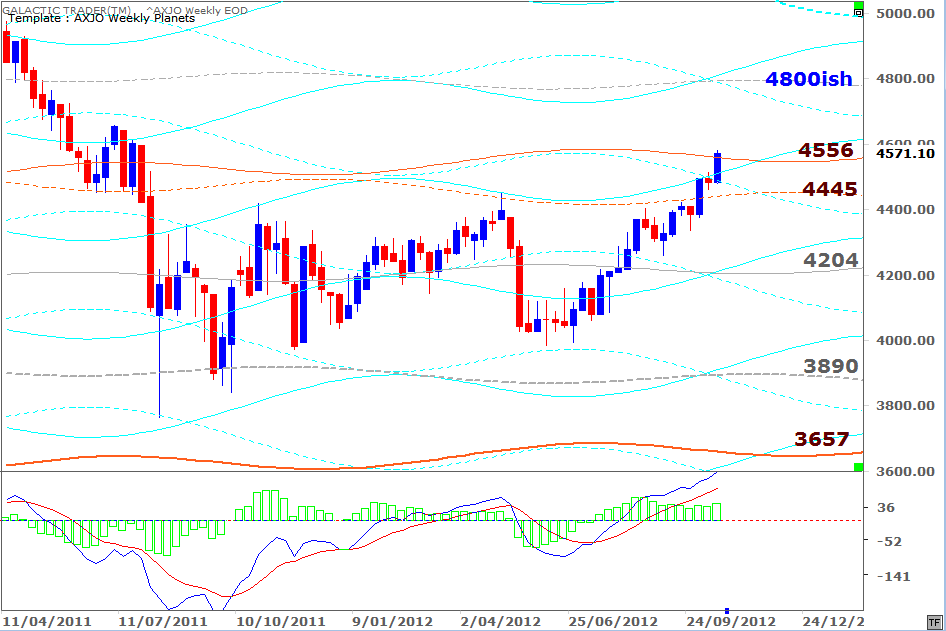
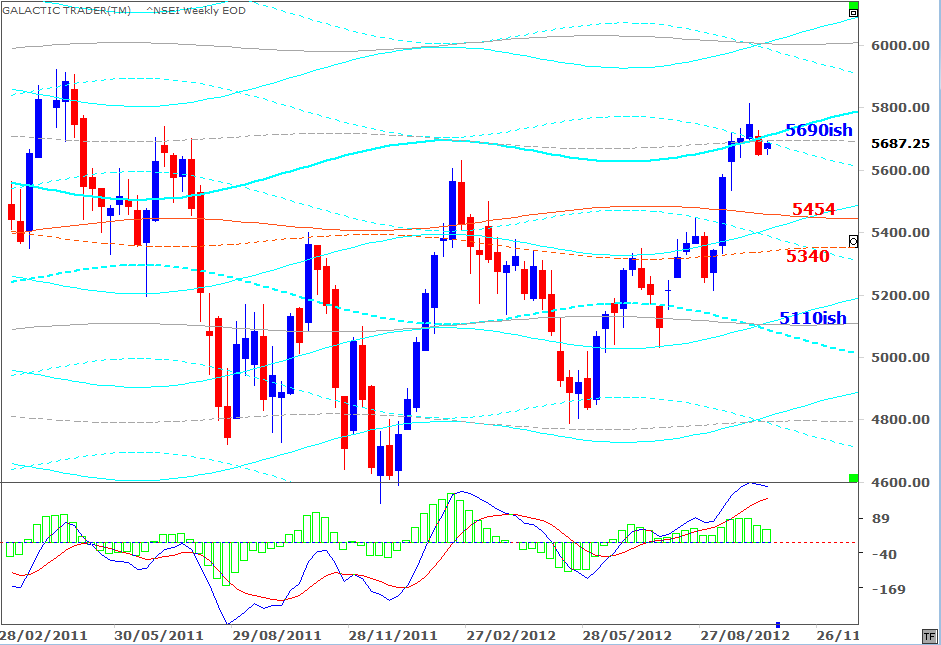
So, here's an update of the Weekly Planets charts for various indices to help guide your decisions.
FTSE:
DAX:
ASX 200
India's Nifty
Singapore:

