End-of-quarter book cooking
Week beginning March 26, 2012
The coming week brings the end of 1Q 2012 and with one eye on their bonus calculations a lot of the big boys will be anxious to dress-up the books.
Copyright: Randall Ashbourne - 2011-2012
We are in the period between New Moon and 1Q Moon, which is statistically negative - though often not quite as much so as the 1Q-Full Moon phase.
Last week did bring about a taste of the negative volatility expected, when I said:
"Nevertheless, there will now be a fundamental shift in the nature of the energy. Mercury is going backwards, the Sun is about to enter the aggressive action sign of Aries, both of them are going to conjunct Uranus, and we're heading into a New Moon in Aries which sets off the long-range negative energy of the still-developing Uranus/Pluto square."
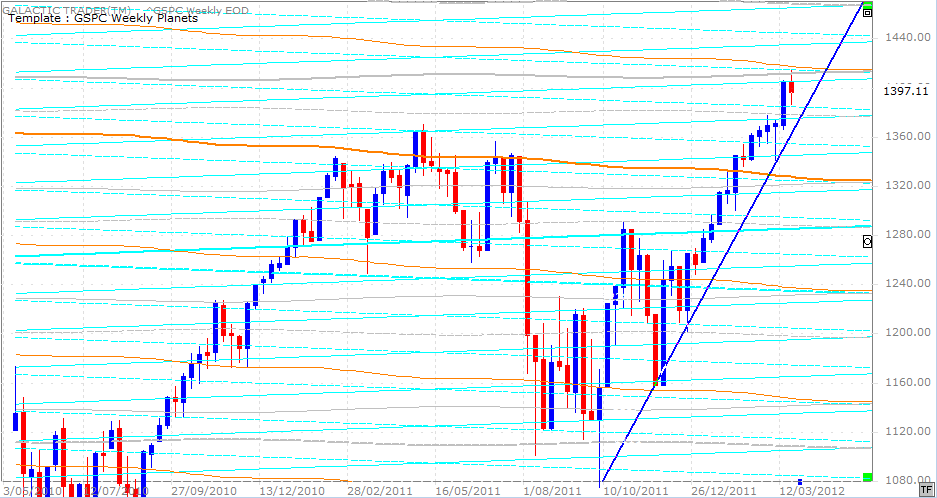
Pollyanna peaked on Monday, interestingly enough with the anticipated touch of the major Neptune line on her Weekly Planets chart, and then began a decline.
The coming week is relatively quiet in terms of The Spooky Stuff, though there's likely to be another taste of the shift in the energy on Thursday in New York, when the Sun squares Pluto. Symbolically, the spotlight will be back on the sovereign debt issues in a big way.
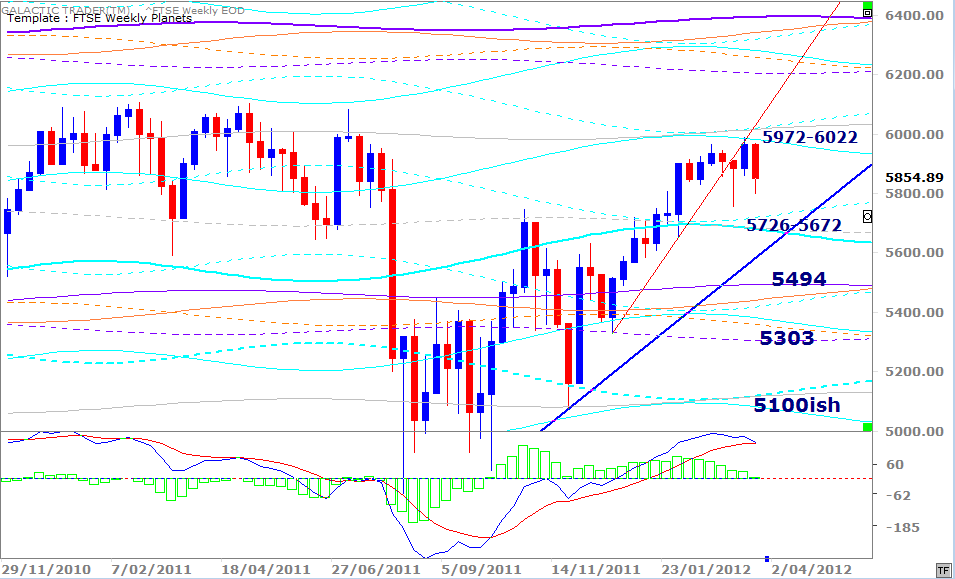
Too early to be sure yet, but London's FTSE may have peaked right on cue ... with a High on March 14.
There was a study conducted a few years ago which showed a strong tendency for the SP500 to put on marked gains in the 6 days straddling the end of each month - and the effect was even more marked at the end-of-quarter months.
Tuesday sees the Moon moving into Gemini for a couple of days, which often brings about wide-range days ... in both directions.
Tuesday sees the Moon moving into Gemini for a couple of days, which often brings about wide-range days ... in both directions.


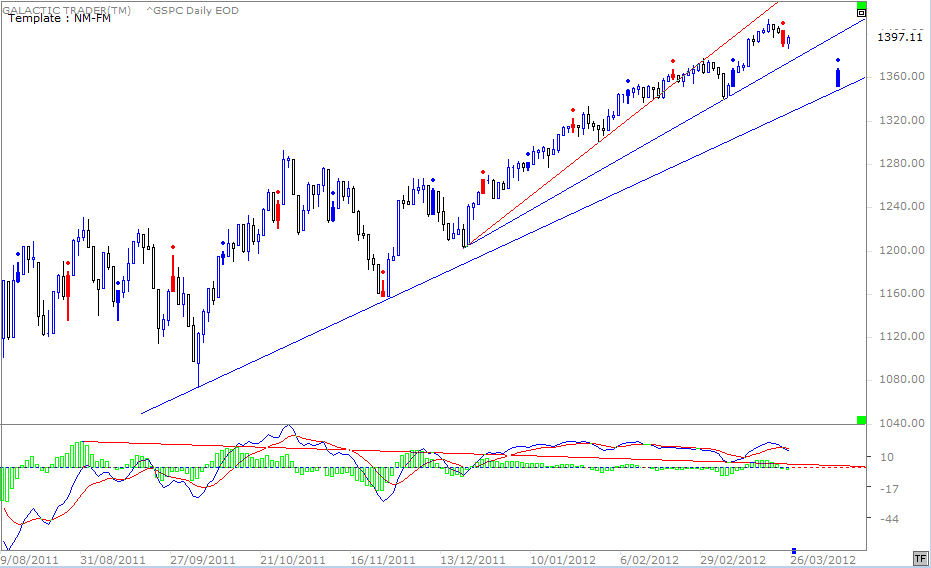
We'll begin this weekend by having a look at the New Moon - Full Moon behavior recently on Pollyanna, the SP500.
In The Moods of The Moon chapter of the book, I detail the profits to be made over the longer-term simply by trading the lunar phases ... and earlier this year one of my readers outlined a variation on the theme which boosted the profits (Archives 2012 - February 20).
In the chart above, New Moons are solid red (indicating prices are peaking and, statistically, will tend to track sideways or drop into the next Full Moon). The Full Moons are solid blue bars, to suggest a positive turn northwards again.
The lunar phases are a relatively mild affair in terms of energy shifts and the long-term statistical tendencies can be thwarted in the short-term by more powerful aspects involving the major planets. Last week, for example, the expectation of a more negative trend caused by the Sun and Mercury aspects to Uranus turned out to be the stronger influence.
The fast, red trendline has been lost and failed to be regained; the shallower, blue trendline is still holding - as is the even slower one below it. Both MACD signals continue to diverge negatively, with the weakness particularly strong in the histograms.
So, for this week we have to balance our expectations. There is the implied jerkiness of the Moon in Gemini and the negativity of the Sun square Pluto aspect, both of which have to be balanced against the seasonal tendency and the need for fund managers to make themselves look good.
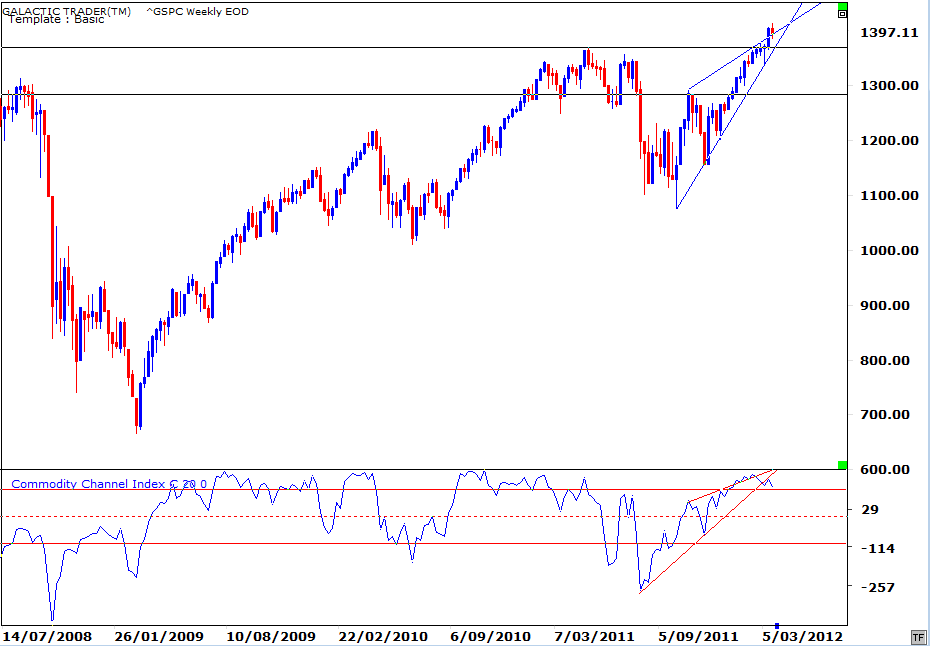
On a purely technical level, the previous week brought about what might yet turn out to be the final exhaustion run we discussed with the Venus-Jupiter conjunction in Taurus, simultaneously making a Grand Trine with Mars and Pluto.
These throw-overs are not uncommon with an Ending Diagonal pattern ... and there is some potential significance shown by the disagreement of the oscillator.
These throw-overs are not uncommon with an Ending Diagonal pattern ... and there is some potential significance shown by the disagreement of the oscillator.
Safe trading - RA
(Disclaimer: This article is not advice or a recommendation to trade stocks; it is merely educational material.)
Polly's Weekly Planets chart is above and last weekend I made this point:
"... it could well be heading for a primary Neptune line priced at 1411. As we can see, there was a cyan Saturn which capped the rise just short of the grey Neptune level. It would be a bit odd not to actually make at least a touch of that line - and maybe in the coming week when the lunar phase, going to the Arien New Moon, has a positive statistical tendency."
And so it transpired. Recently, I showed a long-range planets chart for Pollyanna - speculating this rally to finally top out around 1411, or perhaps as high as 1469 - though that is a target which cannot be achieved unless this index actually is back in full Bull mode.
Unlike other major indices, Wall Street has gone a few per cent higher than I'd been expecting and it continues to maintain that very sharp weekly trendline. My prediction for a mid-March topping out still stands at this point, but given the seasonal factors still in play and the fact that it's an election year in the United States, I want to see that trendline broken decisively before turning overly Bearish.
As I said earlier, London's FTSE index may have topped out right on my first predicted turn date for the year and if that is so, major world markets are entering a decline which won't finish until November - and may go much longer.
While Polly was still gushing last week, the FTSE was decidedly more negative. The MACD histograms have been in steady decline and the signal lines are on the verge of giving a negative crossover.
While Polly was still gushing last week, the FTSE was decidedly more negative. The MACD histograms have been in steady decline and the signal lines are on the verge of giving a negative crossover.
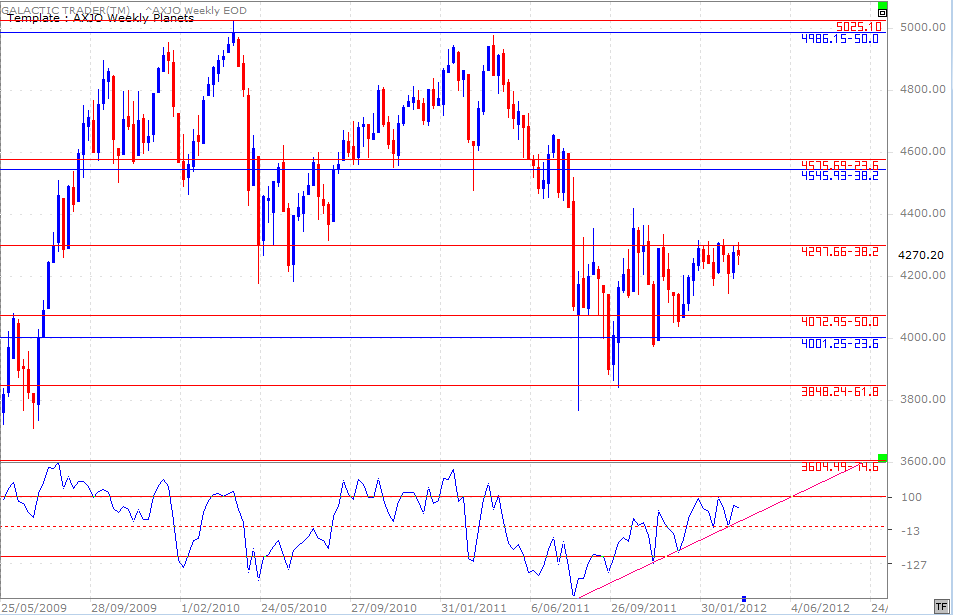
The ASX200 (above) again found Resistance at that Fibolin string which is acting more like a concrete barrier. I've discussed this at length in previous editions and there's little point in reiterating how to handle it from a trading viewpoint.
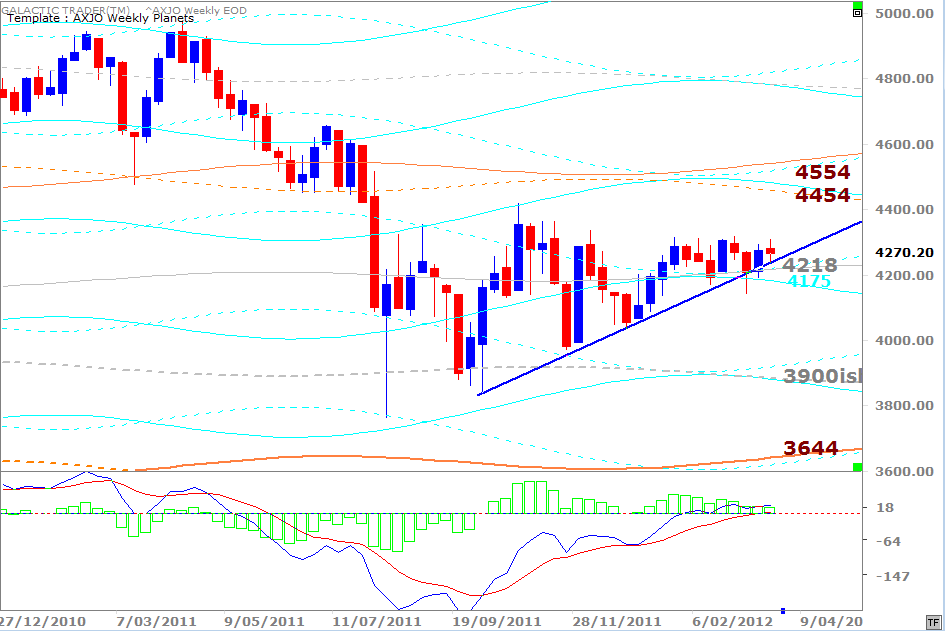
We still can't be certain if the old bat is going to break out or break down. She continues to hold not just the Saturn/Neptune price lines on her Weekly Planets chart, but continues to close each week above the trendline.
We can be reasonably sure the move, when it finally comes, will have a great deal of pent-up energy behind it and it will be fast and strong.
And probably not too far away ...
We can be reasonably sure the move, when it finally comes, will have a great deal of pent-up energy behind it and it will be fast and strong.
And probably not too far away ...
Auntie has been wound tighter and tighter since the August plunge and the October TAS move ... which is a long time to coil.
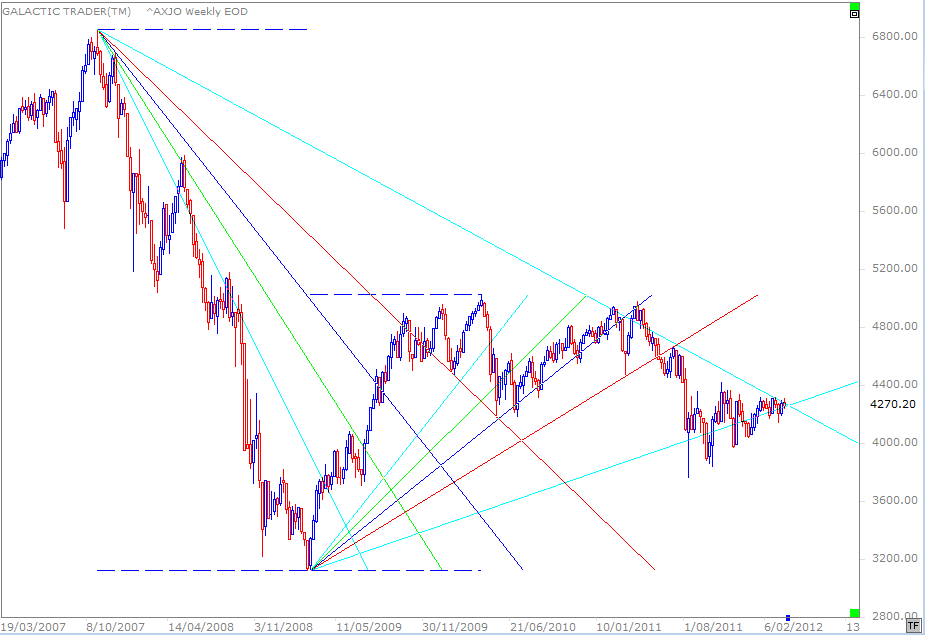
The chart above uses two sets of Fibonacci arcs ... one set coming down from the Bull peak and the second arcing upwards from the Bear bottom. And, as we can see, she's currently at the intersection of the outer limit of both sets.
Crunch time appears to be close-at-hand.
The chart above uses two sets of Fibonacci arcs ... one set coming down from the Bull peak and the second arcing upwards from the Bear bottom. And, as we can see, she's currently at the intersection of the outer limit of both sets.
Crunch time appears to be close-at-hand.
