
Are we there yet?
Week beginning March 19, 2012
Well, so far so good. My face is not covered with large amounts of egg. At least, not yet!
Copyright: Randall Ashbourne - 2011-2012
What we do not yet know is whether that was the final exhaustion run. In The Technical Section of the book, I discuss how a breaking of the outer barriers of the Bi-BBs usually results in either a sideways consolidation or a change of direction. We'll have a look at that shortly.
Firstly, though, I'm going to talk about some Spooky Stuff. The Venus-Jupiter conjunction in Taurus is a once-in-12-year event ... and having that occur in a simultaneous trine is much rarer. My astrological expectation is that that was The Peak. But, we need technical confirmation. And, we also have to take into account that such a rare event is not merely a brief, short-lived affair, but has an "orb" of influence which extends past the exact dates.
Nevertheless, there will now be a fundamental shift in the nature of the energy. Mercury is going backwards, the Sun is about to enter the aggressive action sign of Aries, both of them are going to conjunct Uranus, and we're heading into a New Moon in Aries which sets off the long-range negative energy of the still-developing Uranus/Pluto square.
With the Sun in Pisces, along with Neptune back in its home sign, we've just been through a period of looking at the universe with rose-coloured glasses. Reality is about to bite with a sudden shock to the system.
We have been discussing for some time now the probable result of last week's astrological energy feast of Venus and Jupiter meeting up for a kissy/smoochy in Taurus, while making a Grand Trine with Mars in Virgo and Pluto in Capricorn, the other two Earth signs.
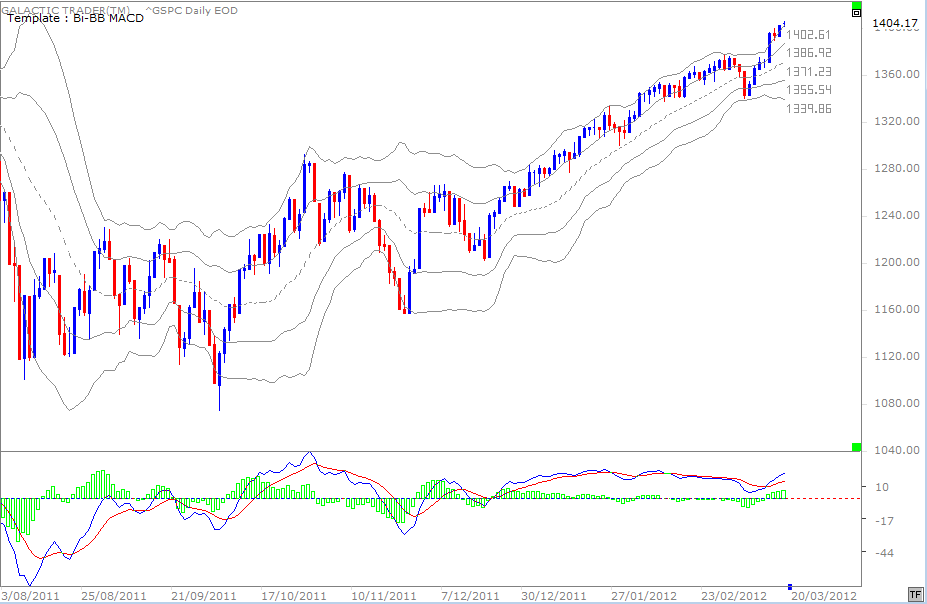
I'd expected such a rare burst of stable, positive energy to result in an exhaustion run ... and almost all of the American indices broke the upside Bollinger Band barrier last week.
I'd expected such a rare burst of stable, positive energy to result in an exhaustion run ... and almost all of the American indices broke the upside Bollinger Band barrier last week.


I mentioned last weekend that topping is often a "process" and is not always obvious in advance. While the Taurean stability we've discussed for the past few weeks now begins to fade - and will be shaken up by Uranian shocks over the course of the next 7 trading days - it's not certain that stocks, even Pollyanna, are about to go into a death dive.
We will begin our journey this weekend with a look at Galactic Trader's Bradley Model turns.
The red line on the Price chart for Miss Polly, the SP500, is the traditional calculation of the Bradley Model ... and it actually is indicating a death dive about to get underway as the index peaks into the first major turn date of the year.
The blue line is Yuri Shramenko's variation of Bradley's methodology ... and it is suggesting the alternative of a longish period of sideways distribution before the collapse begins.
The blue line is Yuri Shramenko's variation of Bradley's methodology ... and it is suggesting the alternative of a longish period of sideways distribution before the collapse begins.
The chart above is Pollyanna's daily Bi-BBs ... and we can see last week's run to the expected new Highs broke the upper band for the first time since the TAS Low last October. It's rather unfortunate that Yahoo is now accepting the lies from the New York Stock Exchange about the official Opening price of the index each day - rather than the evidence of its own live charts.
Tuesday actually opened with a large gap upwards to vault the price over the Resistance level ... and that wasn't the only gap up in the past couple of weeks. It's a pity Yahoo has allowed itself to be conned, not simply because the the presence of gaps gives some ideal short-term trades, but because the use of fake Opening prices can distort signals on the oscillators.
Look, I can't help myself. I'm going to digress and have a very brief tirade. Because it does have some relevance to the nature of the Uranus/Pluto square, which I've discussed at some length in Forecast 2012. Uranus in Aries is aggressive revolution challenging Pluto in Capricorn, which is Big Money determined to maintain the status quo.
The crookedness of the American "system" is getting way out of control. Forget the fact that Goldman's latest PR head has walked into the job straight out of the US Treasury; forget about the revolving door which seems to link GS, the Federal Reserve and the US Treasury in its own closed Grand Trine; forget about the "muppets". And remember that Goldman's had a $4 billion stake in Kinder Morgan while charging El Paso $20 million for advice on how to get the best out of a takeover by Kinder Morgan.
These people make the Suharto and Marcos families look like petty pickpockets. The Uranus/Pluto square event occurring over the next few years warns that, just as with some of the Arab dictators, the day of reckoning is not far off.
In the context of the Kinder/El Paso deal, fiddling the Opening prices each day on the NYSE is nothing. Other than that it shows there's no sewer so low that some rats won't go down. End of rant.
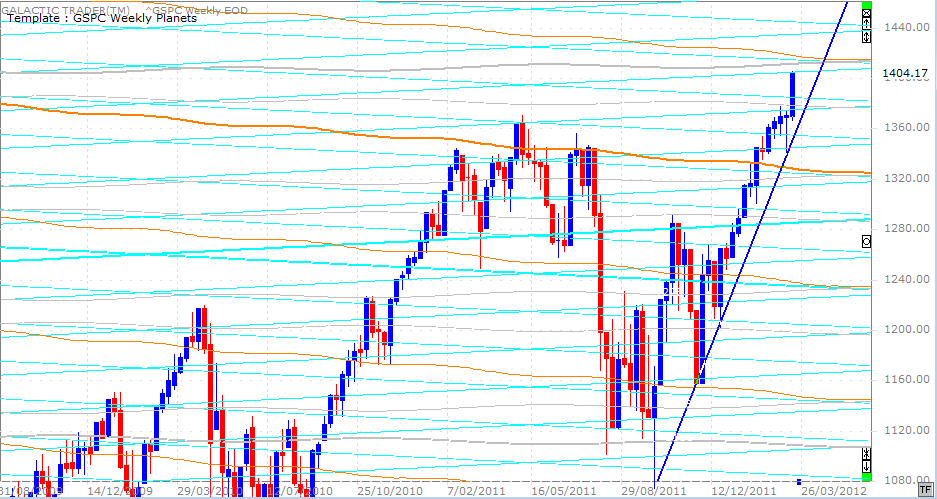
Let's get back to the charts ... and below is Polly's Weekly Planets chart.
Safe trading - RA
(Disclaimer: This article is not advice or a recommendation to trade stocks; it is merely educational material.)
Last weekend, I showed my Polly Long Range Planets chart and, in the expectation of an exhaustion run to coincide with the Venus/Jupiter kissy/smoochy, made the point it could well be heading for a primary Neptune line priced at 1411. As we can see, there was a cyan Saturn which capped the rise just short of the grey Neptune level. It would be a bit odd not to actually make at least a touch of that line - and maybe in the coming week when the lunar phase, going to the Arien New Moon, has a positive statistical tendency.
If there's going to be a turn, or a sideways distribution pattern develop, I'd lean towards some very heavy Resistance immediately overhead in the SP 500.
Next, we'll get Australia out of the road and then have a look at the Footsie.
If there's going to be a turn, or a sideways distribution pattern develop, I'd lean towards some very heavy Resistance immediately overhead in the SP 500.
Next, we'll get Australia out of the road and then have a look at the Footsie.
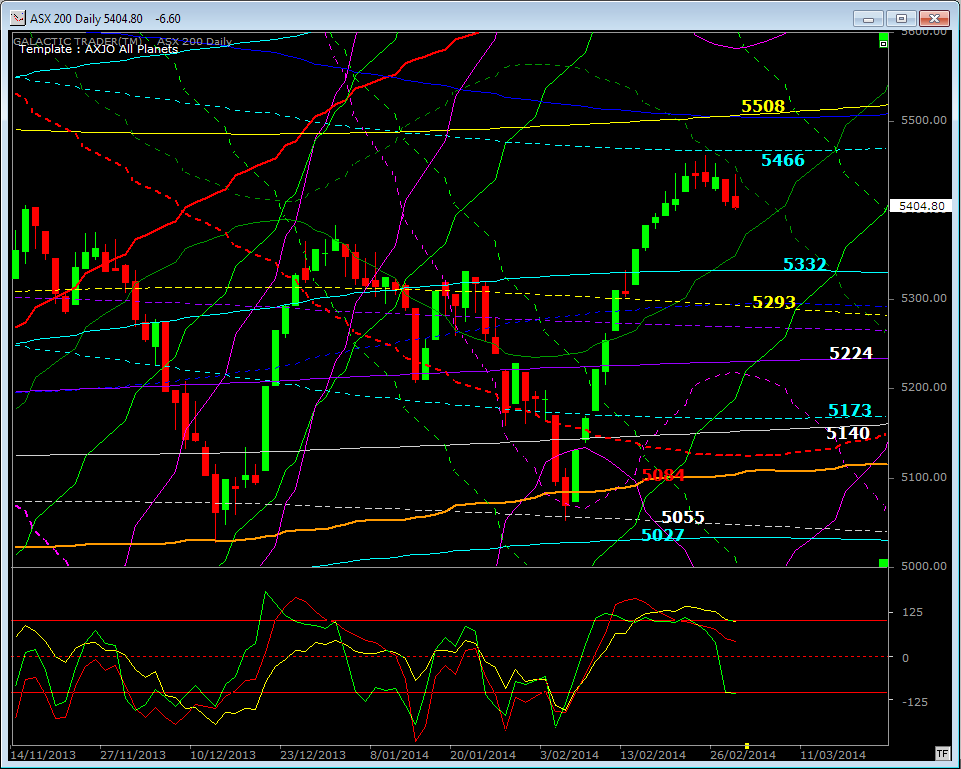
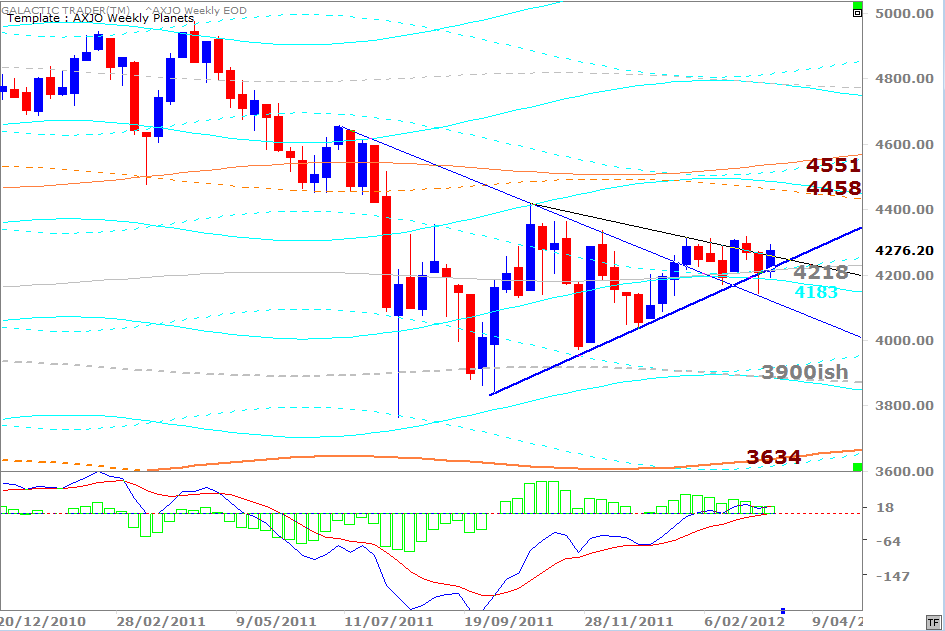
We had a brief chat about this chart last weekend and the real trouble the ASX 200 is having getting a break above the 4300ish level ... and it was deja vu all over again. Drives yuh nutz!
Auntie's Weekly Planets chart is above and I've tweaked the relevant Price levels. She's still holding the Neptune/Saturn level on the downside, but a breakout higher is now starting to look somewhat less likely.
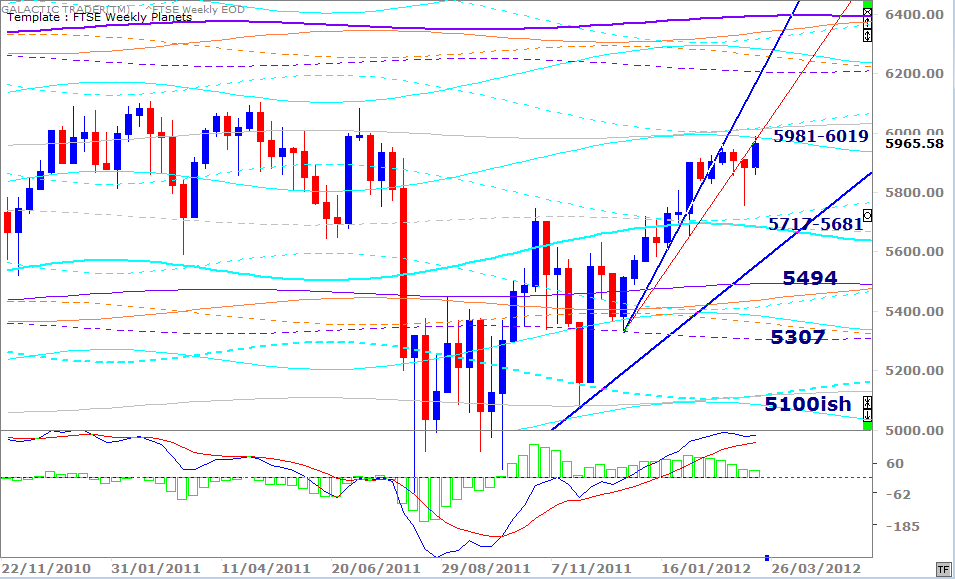
And the FTSE is now also starting to look a bit iffy - with the failure to get its head above planetary Resistance.
And the FTSE is now also starting to look a bit iffy - with the failure to get its head above planetary Resistance.
The positive momentum suggested by last week's astrological aspects produced a strong bounce back to the underside of the second broken trendline ... and a touch of a Saturn barrier. The implications are pretty obvious and along the same lines I was talking about with Auntie last weekend. We could either Buy a breakout of the barrier and use it as a Stop Loss to protect our capital, or initiate a Sell around these levels, again using that current barrier as a Stop.

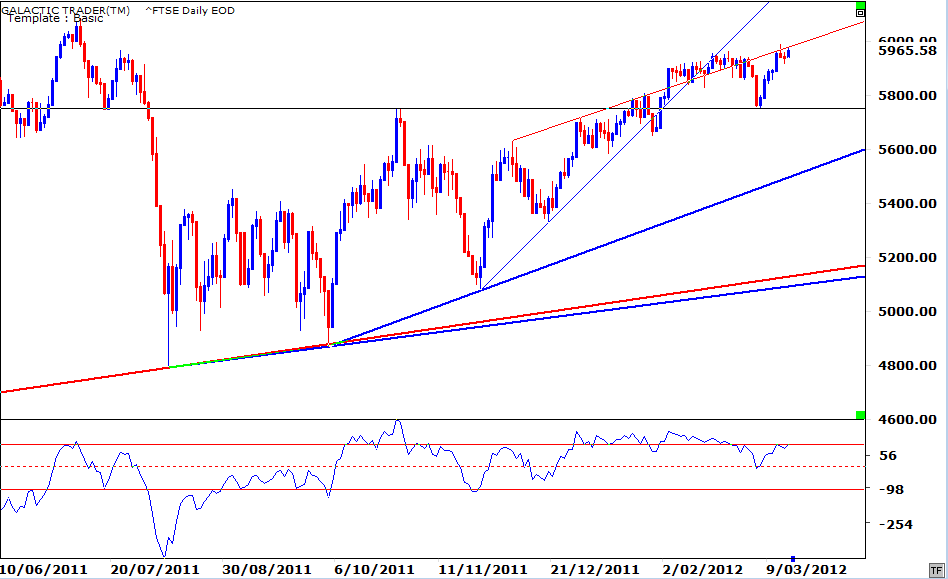
That red trendline I put in place ages ago when it looked as if an Ending Diagonal might be in play, is now acting as topside Resistance rather than underlining Support. There is a smidgeon of negative divergence evident in the state of the Canary. While Price is slightly higher, or around the same level, the oscillator is not. It's having trouble getting back over the +100 level and the last trough went lower.
We seem to have technical backing for a less-than-optimistic outlook based on the planetary prices and the changing astro energy.
We seem to have technical backing for a less-than-optimistic outlook based on the planetary prices and the changing astro energy.
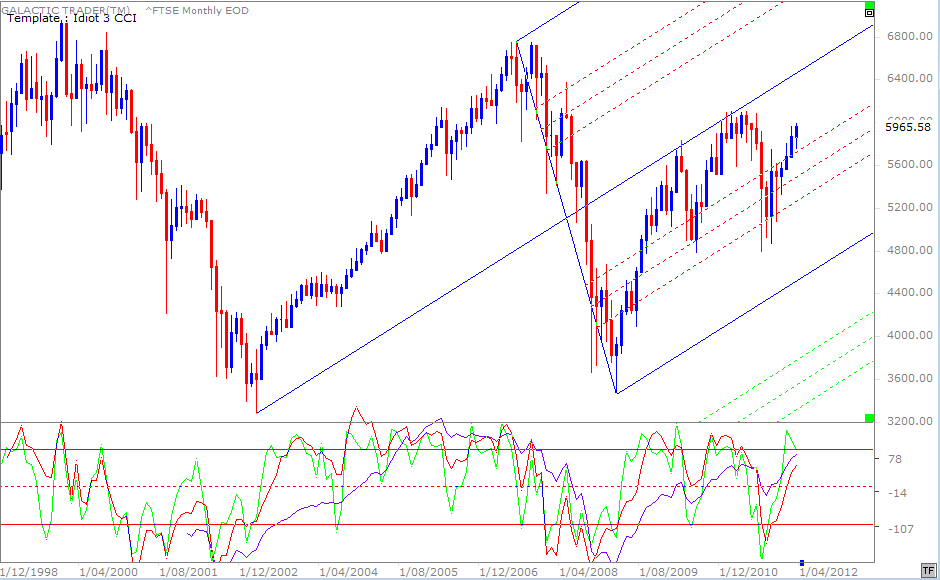
So, let's look at the potential risk to opening a FTSE Short at these levels - and we'll use a monthly because we want to see what the whole forest is looking like. Point one: Like almost all other major indices, the FTSE thinks Pollyanna is off with the pixies.
Using a pitchfork, we can see a few things. It is possible to conclude the index is in a new Bull market. But the upside has been capped by the central tyne of the fork. Still, downside moves are closing within the internal Fibonacci strings.
The mid-range Canary - the red one in the lower panel - is singing decidedly off-key, apparently intent on putting in another lower peak. The green one has reached a point consistent with near-term tops developing and has turned down, depite the higher prices.
The long-range - the blue bird - continues to be what I've mentioned recently as "the elephant in the room". It endorses the rally and is a warning that while, astrologically, we expect a new Bear move to develop I may yet need to swap the black RayBans for a set with a rosier tint.
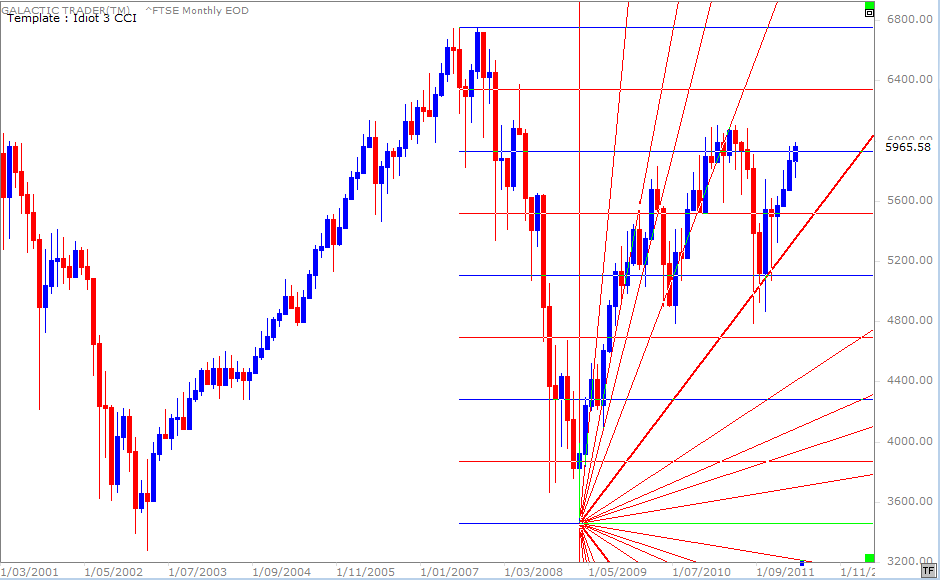
And our final chart for this week is a Gann view. We had a few "false break" spikes down past a Gann price division and the primary Gann angle during the plunge into August/October. None of the bad months actually closed below that joint level of division/angle and the bounce has been reasonably strong.
So, on the daily and weekly level we can see the obvious barriers - but a couple of different monthly views offer up an alternative scenario at work. Again, it's relatively easy to play with not a large amount of risk. Well, little risk IF YOU USE THE OBVIOUS STOP LOSS positions.
Okay, folks, y'all know what I think. The Spooky Stuff did its expected thing exactly when it should have done. Are we there yet? Well, I think the vacuous troll really ought to touch Neptune and then swoon. Auntie and the Footsie may also be ready to roll since the grand Taurean love fest couldn't get them above the hurdle.
Now, if only that bloody elephant doesn't shit all over the Bear rug!
