Is this The Week of a multi-year High?
Week beginning March 12, 2012
And so we now arrive at the grand finale ... a fabulous feast of astrological peak energy.
Copyright: Randall Ashbourne - 2011-2012
Those of you who have read my Forecast 2012 will know the week ahead is the first of my predicted major turn dates for the year. The entrails have been discussed in the past few weekend editions and The Jupiter Cycle essay, which paints the big picture, is available under the Articles button.
Last weekend, I warned there was an elephant in the room with the capacity to overturn the forecast ... and he's still there.
Nevertheless, I have been expecting for many months now that markets would top out in the late February to early March timeframe - with March 13/14 as the potential peak dates.
We should remember that topping is a process and is not always obvious in advance; unlike bottoms which tend to be more clear cut.
I have discussed the Venus-Jupiter-Mars-Pluto love fest Grand Trine in some detail in recent weeks, so there's not much point in reiterating the symbolism.
Mercury, the Old God of communication, turns Retrograde for a few weeks. I don't place much emphasis on Mercury Rx. However, it is a time when many people make silly mistakes through inattention ... pressing the Sell button when they actually meant to Buy. And it's a time when people have a "rethink" about what's happening.
It is the week where Venus joins Jupiter in her home sign, Taurus, as the two benefic Old Gods simultaneously trine both Mars and Pluto ... and Mercury, the adolescent trickster, turns Retrograde.
If the historical patterns hold true-to-form, we are now within the exact timeframe likely to produce a multi-year High in the markets.
If the historical patterns hold true-to-form, we are now within the exact timeframe likely to produce a multi-year High in the markets.


Last weekend, we discussed the energy of the Sun opposing Mars and Venus opposing Saturn having the ability to turn markets.
We chatted about the potential for Chicken Little to be just offstage, cueing his Awoe! Alas! routine for a reappearance, but in the context "that the overall 'pattern' still allows for a quick correction and final exhaustion run."
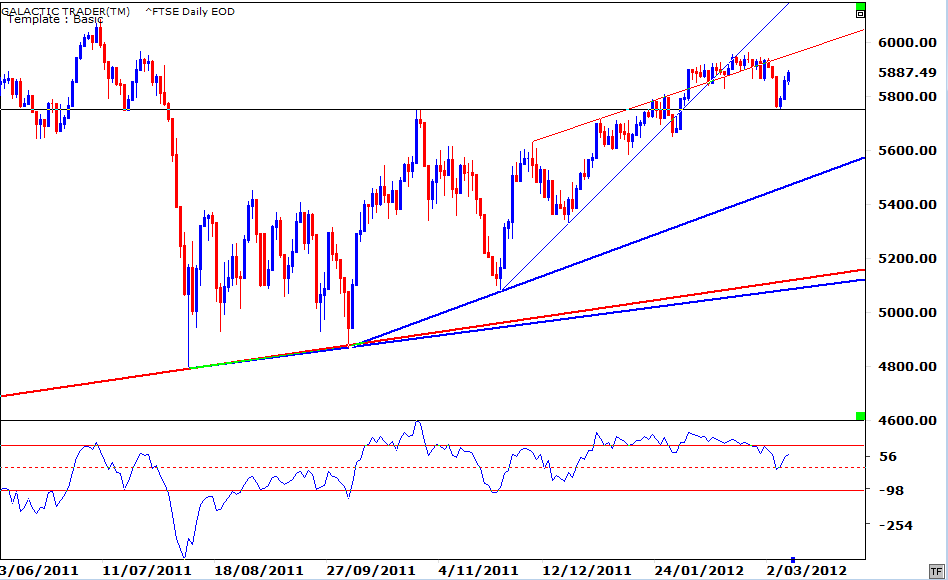
And the gameplan is still in play. We'll use the FTSE as a reminder of the daily action - and the remainder of the charts this weekend will concentrate on a broader picture.
FTSE Daily:
And the gameplan is still in play. We'll use the FTSE as a reminder of the daily action - and the remainder of the charts this weekend will concentrate on a broader picture.
FTSE Daily:
So, the negative energy build-up last weekend of the Sun/Mars and Venus/Saturn aspects had immediate effect as markets opened for the week - a sudden and fast drop, with the FTSE bouncing from the "obvious" Support level of the previous High. And the turnaround was almost equally sharp, which is something we'd expect with Venus leaving the uncomfortable territory of Aries and moving into her seductive, luxuriant home territory for a meeting with a materially expansive Jupiter.
I have long expected this week's set of aspects to produce "a final exhaustion run". We may well be right in it. But the potentially Bearish intermarket divergence I mentioned last week between los Yanquis and the Rest of the World continues to build - and we can see it easily by comparing Pollyanna, the SP500, with her daily opening act, the FTSE.
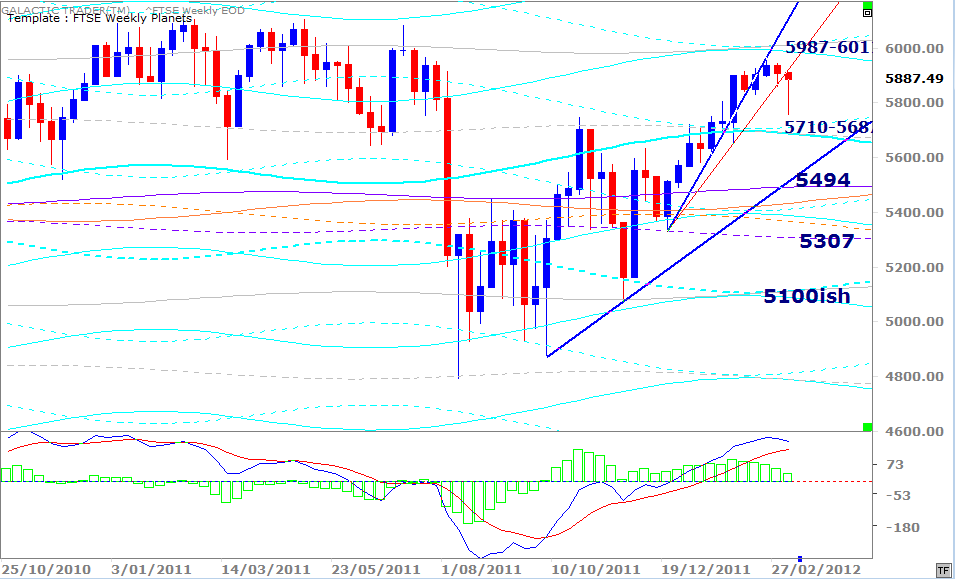
FTSE Weekly Planets:
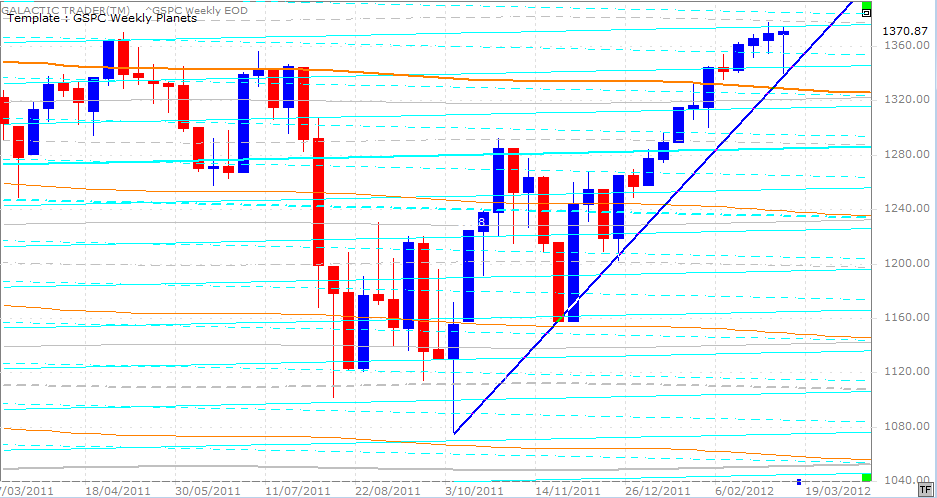
Ignoring the planetary price levels for the moment, we can see the FTSE has now fallen off two sharp trendlines - while Pollyanna has bounced from its too far-too fast trend (below).
Pollyanna Weekly Planets:
Pollyanna Weekly Planets:
Just eyeballing the Price levels, we also get the sense that the FTSE is having a little more difficulty than the SP500 in maintaining high levels of support.
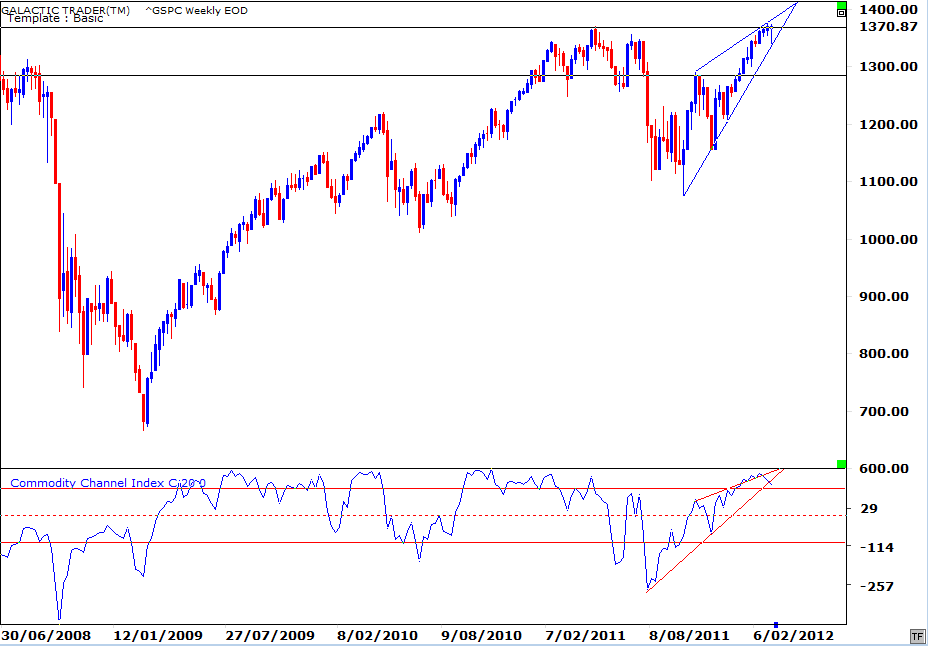
Pollyanna Weekly:
Pollyanna Weekly:
Safe trading - RA
(Disclaimer: This article is not advice or a recommendation to trade stocks; it is merely educational material.)
Looking at a technical weekly of Pollyanna, Price remains contained within a rising wedge - usually a Bearish structure - but the intermediate-range Canary, the 20CCI, is beginning to breakdown from its equivalent wedge.
So, let's look at where a final splurge might take us this week if the Taurean trinal party pulls out all the stops.
SP500 Long Range Planets:
So, let's look at where a final splurge might take us this week if the Taurean trinal party pulls out all the stops.
SP500 Long Range Planets:
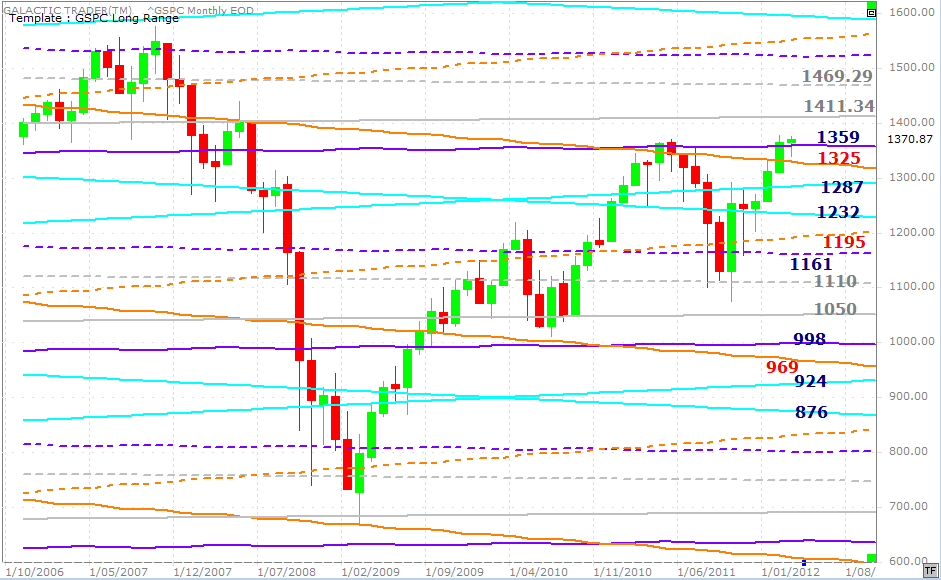
This is my Pollyanna Long Range Old Gods chart ... with the added inclusion of some cyan Saturns, which are really more intermediate targets, rather than long-range. I had expected that Polly ought not break above the purple Pluto line. But, it has ... and that does open up the potential for a run to Neptune.
The August-October plunge was stopped in its downfall by the Neptune line at 1110, so a form of synchronicity might be at work, giving targets of 1411 or even 1469.
If either of those were to be reached, I could be forced back to the drawing board to come up with a new gameplan because it would tend to indicate that the Bear died in March, 2009. Y'see, in terms of Elliott Waves, clear new Highs would suggest a new Bull market started 3 years ago ... rather than merely a large correction within an ongoing Bear.
Now, that flies in the face of a lot of other evidence and astrological precedence and history. It would also mean that the Wave 4 corrective decline fell way back inside the territory of the impulsive rally, Wave 1. And that's supposed to be a real EW no-no!
So, for the moment, I continue to think the crooks are playing with Wall Street and their computers are embarked on a pump-and-dump.
What happens now should tell us.
Auntie's Weekly Planets:
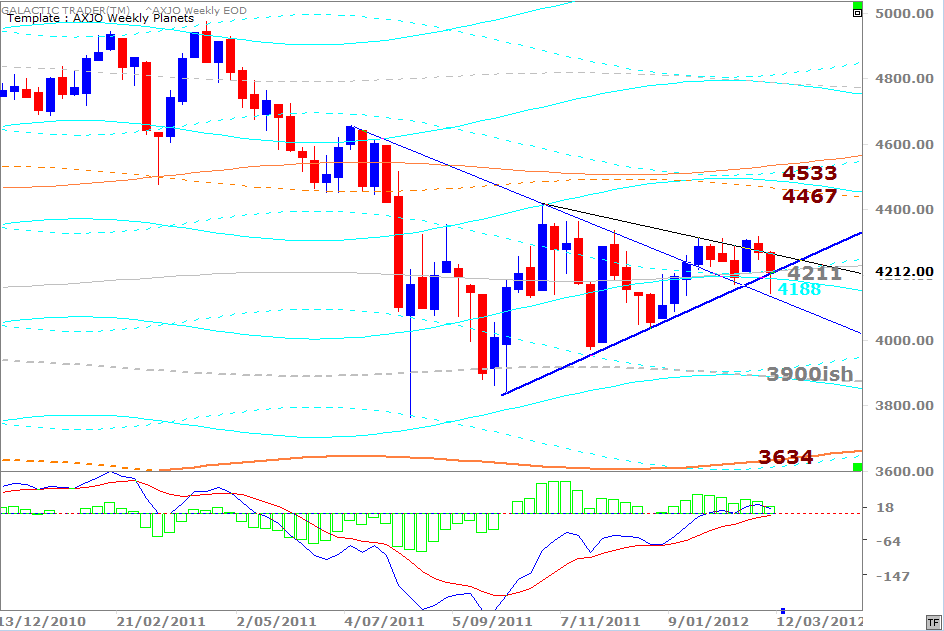
Let's turn our attention now to Auntie, the ASX200, which closed out the week at a virtually exact Neptune price level. Last weekend, I showed a long-range Neptune chart for Auntie.
So, we had a breach and recovery of the weekly trendline running from the TAS (trading against a spike) Low in October, but the action is still contained almost wholly within a symmetrical triangle. I've mentioned in the past that this is normally a continuation pattern, meaning that when the contraction of Price is over, it normally breaks in the direction that it went into the triangle. In this case, the odds favour breakdown, rather than breakout.
But, I reiterate the point: Whichever way it breaks, don't stand in front of it.
ASX200 Fibonacci levels:
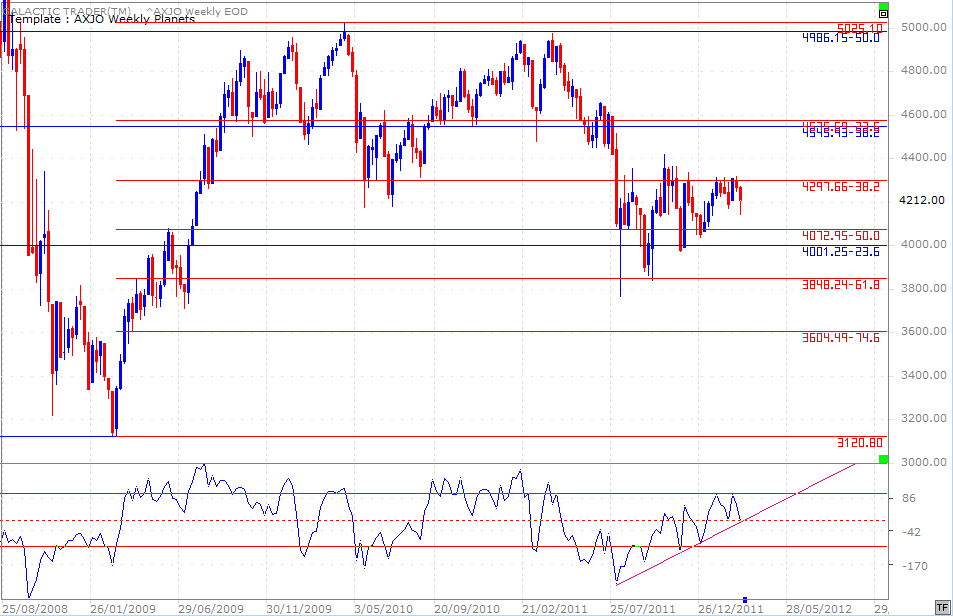
The almost "cheat sheet" Fibonacci chart for Auntie continues to work. The 4300ish level is a real line-in-the-sand. Trendline momentum in the Canary continues to hold, with the oscillator primed for a potential bounce Zero Line Rejection - something which is detailed in The Technical Section of the book.
The state of the oscillator certainly suggests breakout remains possible, perhaps even probable. The state of the planets suggest the breakout could be very short-lived. However, there is little guesswork or high risk involved here. We either get a clear breakout northwards with a very clear and obvious loss-stop level to protect our capital. Or we get a short-lived bounce with a pretty good idea of where to initiate a Short.
So, that's it, folks. We are almost at The place and The time ... a bit of an overshoot of expected Price on Pollyanna and a worrying undershoot on Auntie, with the FTSE wavering between the two but more inclined to follow the American lead.
Next weekend I may have my face covered in large amounts of egg. C'est la vie, non?
