
Major indices close to planetary targets
Week beginning June 2, 2014
With May out of the way, stock markets enter a five-month period which, statistically, tends to be weak.
Copyright: Randall Ashbourne - 2011-2014
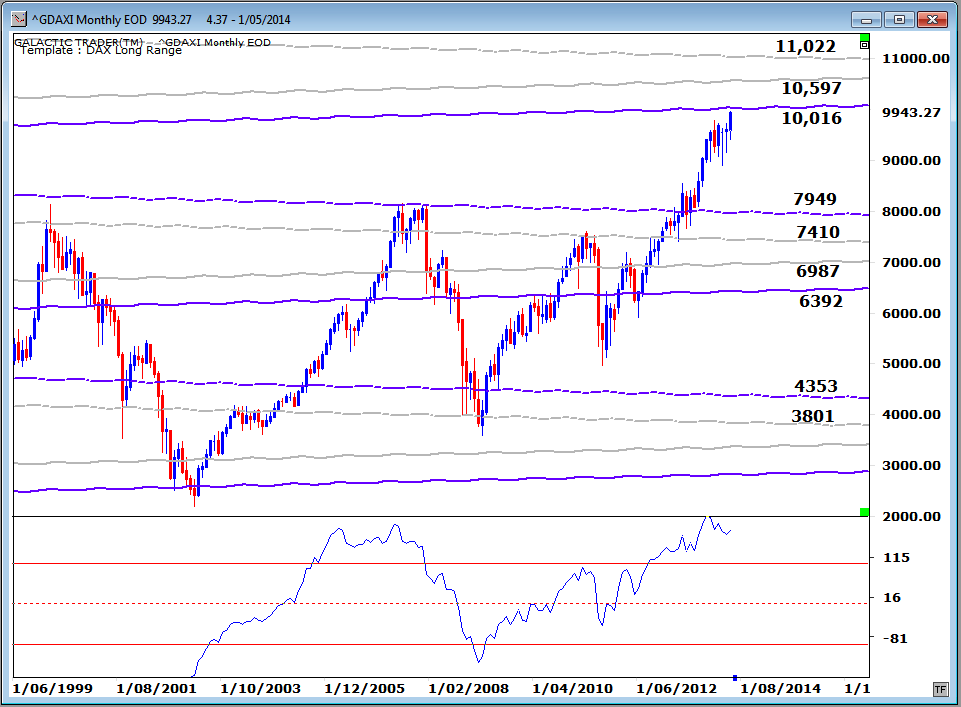
Nevertheless, it managed to get the SP500 out of its trading range and the DAX very close to an important, long-range planetary level we've been assuming "should" be hit.
We'll have a look at charts for the 500, the DAX, the FTSE, the CAC, the Nifty, Singapore and Australia this weekend.
And gold. Yes, that's an egg you see splattered all over my face. GeeZeus, what an unattractive look. The pressure was building for a fast move ... just not in the direction I was expecting it would go.
It could be a Bear trap which suddenly reverses. But, we'll look at that, too.
Wall Street and London were closed last Monday. But, Big Money never sleeps ... and it poured into Frankfurt and Paris last Sunday evening to engineer opening gaps to set up a positive week for stock prices.
Yes, it was the statistically positive period of the New Moon and also the usually positive period going into the monthly changeover.
Yes, it was the statistically positive period of the New Moon and also the usually positive period going into the monthly changeover.


Safe trading - RA
(Disclaimer: This article is not advice or a recommendation to trade stocks; it is merely educational material.)
Astrologically, there are a couple of significant events ahead for June. Mercury goes Retrograde again next weekend and now that Mars is moving direct again, it will set off the Uranus/Pluto square again.
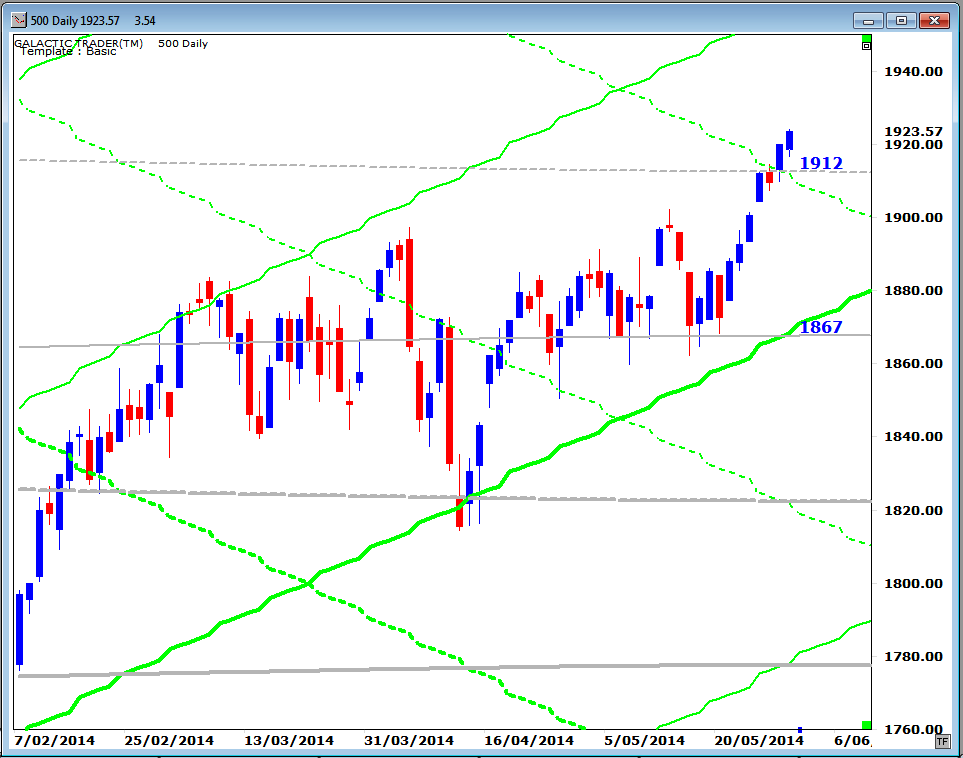
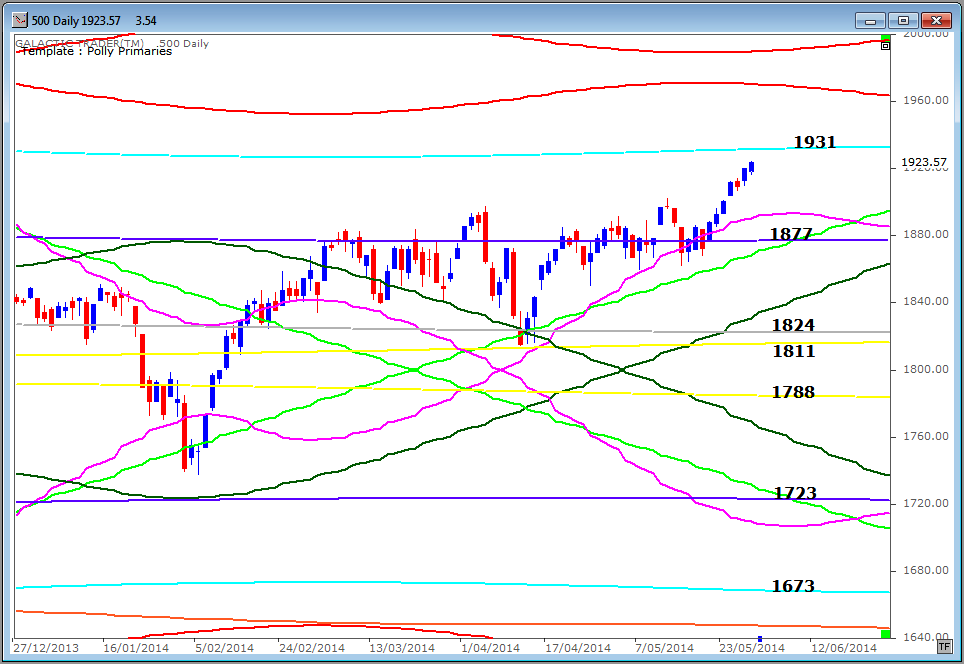
Let's start with Pollyanna, the SP500. We were watching for a decisive close last Wednesday above or below one of the two price levels I showed last weekend for the Sun square Neptune aspect.
As we can see, this set up what is normally a certain play. Tuesday's open gapped upwards, hitting the Neptune price level. Wednesday made a little bounce above the line to touch the falling Sun line and the day ended below the price level of the aspect. This is usually enough to turn the trend, at least temporarily and, often, on an intermediate basis.
Instead, the overnight computers went to work to force a higher open on Thursday, starting the day above the aspect price crossing.
There's a chance it'll turn out to be a false break. I'm not so sure about that ... and not just because of Polly. The DAX, CAC and FTSE are now so close to hitting overhead planetary levels it would be unusual for them not to actually get there before turning south again.
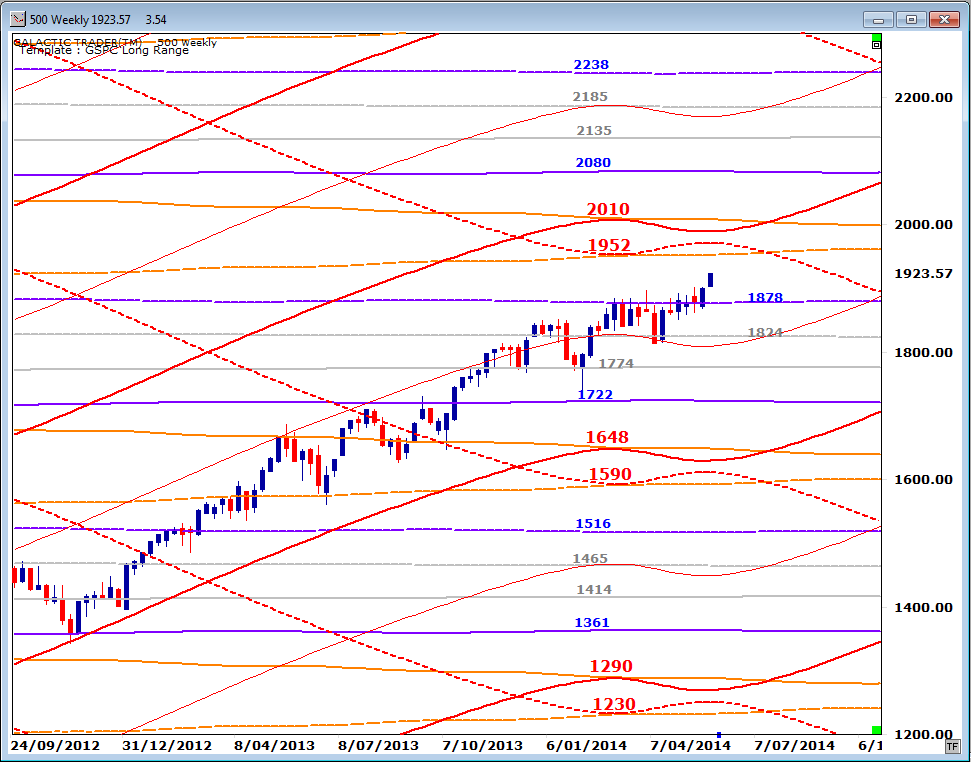
And the 500 also has legitimate higher targets probably now in play. There has been a clear breakout northwards from the long consolidation around the 1870s.
And the 500 also has legitimate higher targets probably now in play. There has been a clear breakout northwards from the long consolidation around the 1870s.

NEW:
Forecast 2014 is now available for sale and download.
Click the button on the right for more details.
Click the button on the right for more details.
The strong barrier provided by that Pluto line in the 1870s is even more obvious displayed on a weekly bar chart, below. Having spent so long battling against it before breaking out, we probably have to lean towards more upside being on the probable side of possible.
And what was Resistance is very likely to morph into Support during the 500's next correction. Note the gap-up week. Germany was similar and the rise there has put the index within close touching distance of a long-range planetary target in the very early 10,000s. In theory, at least, it'll stall heavily if and when it gets there, just as its 2007 market peak got thumped by a similar planetary line.
And it's getting there with negative divergence starting to show fairly strongly in the oscillator.
And it's getting there with negative divergence starting to show fairly strongly in the oscillator.
The FTSE, too, is now only a tad short of hitting its primary planetary target in the high 6900s.
And Paris is also still reaching for its next level.
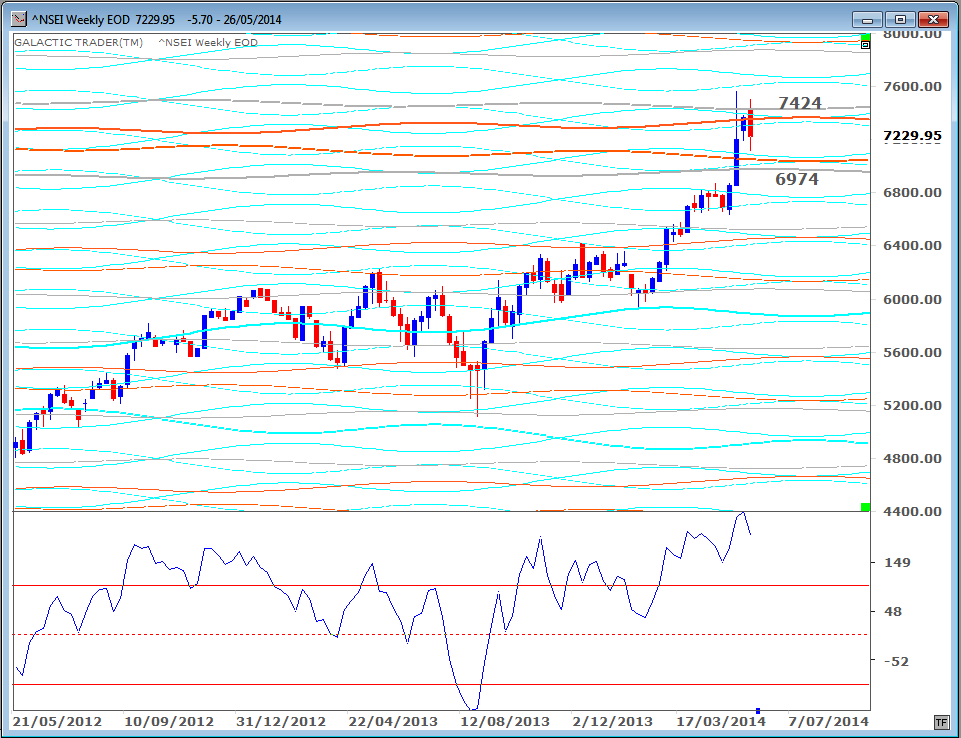
India's Nifty made another breakout attempt last week, but backed off ... suggesting it may need to consolidate the Modi bounce within a Uranus/Neptune price cluster zone.
This is actually a primary planet price zone, as indicated by the width of the lines, and should prove to be very strong, given the way the secondary zones neatly contained prices during earlier sideways shuffles.
This is actually a primary planet price zone, as indicated by the width of the lines, and should prove to be very strong, given the way the secondary zones neatly contained prices during earlier sideways shuffles.


Singapore is another of the major indices still reaching for major overhead resistance. The recent strength in the Big Bird oscillator indicates the target should be reached.

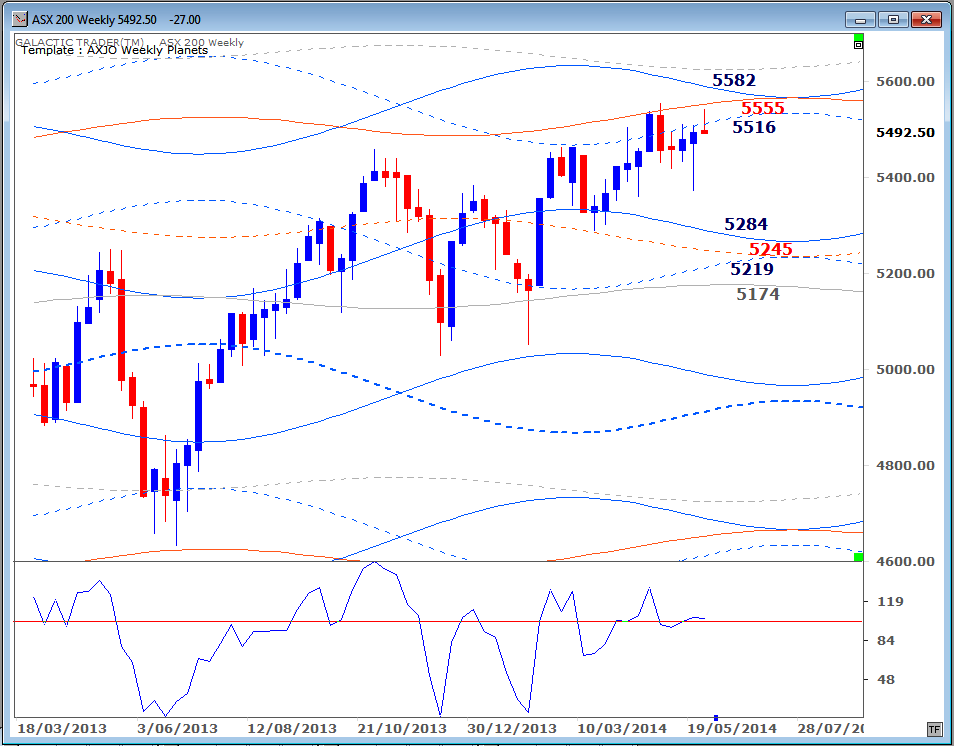
And Auntie, the ASX 200, picked up her skirts and jumped across the weekly Saturn hurdle ... only to realise it was all too much and that she really needed a Bex and a quiet lie-down to recover from all the excitement. I wouldn't mind, if only the silly old bat had actually touched the damn Uranus level now at 5555 before swooning away.
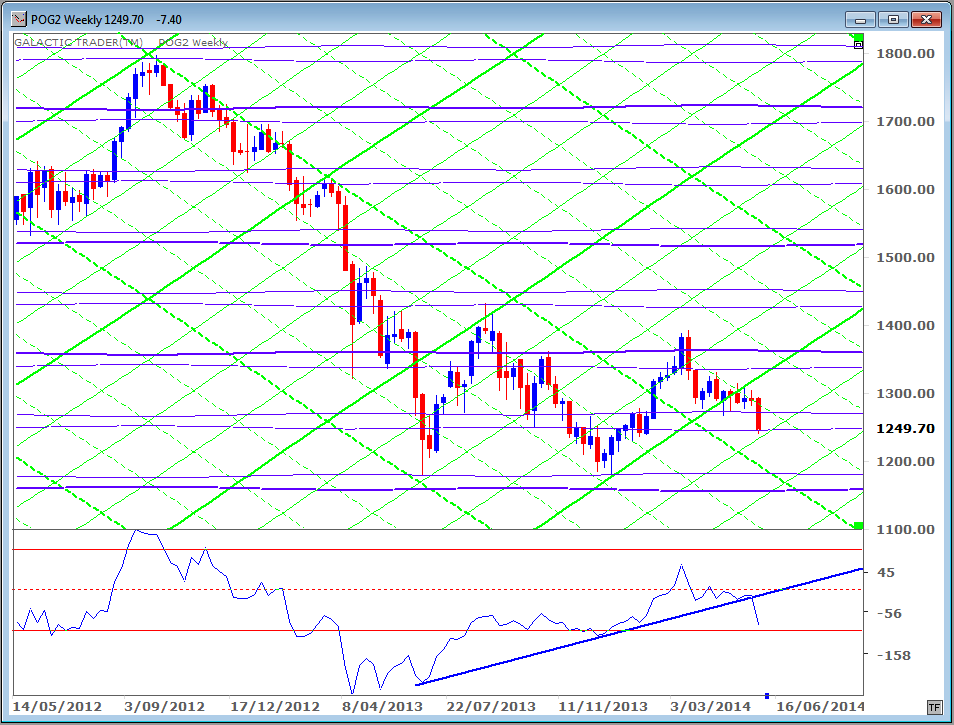
Now, gold. The Memorial Day market was a small-range affair ... and Tuesday went into instant meltdown. Looking at the hourly charts, I have a suspicion the fix was in ... and not just the usual Barclay's "fix".
Nevertheless, it was enough to inflict some major technical damage to the condition of the Big Bird oscillator which instantly croaked and fell of its perch into the toxic dust on the floor.
Nevertheless, it was enough to inflict some major technical damage to the condition of the Big Bird oscillator which instantly croaked and fell of its perch into the toxic dust on the floor.
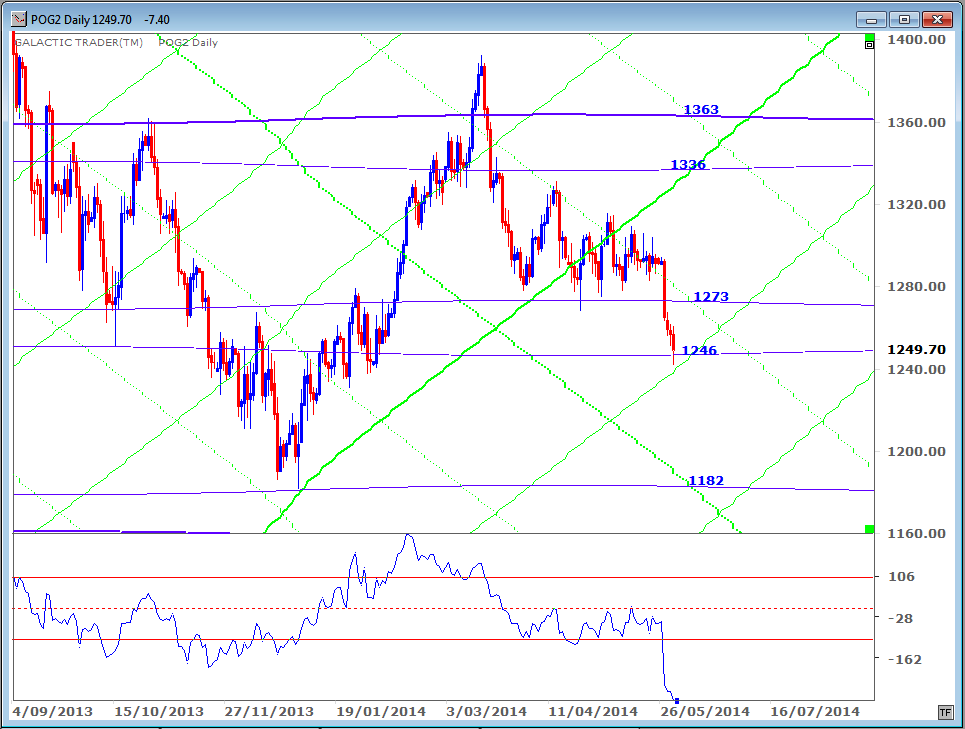
The sharp drop has brought price down to a horizontal Pluto support and potential help from a rising, secondary Sun line. But, it's not just the daily Big Bird which croaked.
Weekly Big Bird had been climbing very nicely along a rising trendline. No longer. We're at, or close to, potential bounce levels, but will have to see what happens in the next week or two to get a better idea of the intermediate direction.
Weekly Big Bird had been climbing very nicely along a rising trendline. No longer. We're at, or close to, potential bounce levels, but will have to see what happens in the next week or two to get a better idea of the intermediate direction.
