
Mid-year review of 2012 predictions
Week beginning July 23, 2012
When I published Forecast 2012 in January, I nominated last week as one of my probable major trend change dates for the year.
Copyright: Randall Ashbourne - 2011-2012
Details of that review can be found under the May 21 button in the 2Q Archives (reached via the yellow button above).
My second predicted turn date was June 25. In fact, most markets bottomed in early June and the listed date was the bottom of the first significant drop within the bounceback rally which started at the beginning of June.
My third date was last week - July 17-19. A couple of weekends ago, I analysed the potential for a Mars-Uranus crash cycle to develop at this time and last weekend we discussed the tendency of markets to go into a spurt-and-reverse cycle as Mercury goes Retrograde.
We will look at all of that again this weekend, along with the fact we are now only days away from a major Bradley Model turn date for the year. Those dates are also listed within Forecast 2012.
Forecast 2012 predicted markets were likely to top out by mid-March and go into a Bear plunge unlikely to terminate before October or November ... and provided a list of dates I thought would see a major trend change occur nearby.
A few weeks ago, I reviewed that preview, indicating that some markets made their High exactly on target and that most had turned down within a couple of weeks either side of the first date listed.
A few weeks ago, I reviewed that preview, indicating that some markets made their High exactly on target and that most had turned down within a couple of weeks either side of the first date listed.


Safe trading - RA
(Disclaimer: This article is not advice or a recommendation to trade stocks; it is merely educational material.)
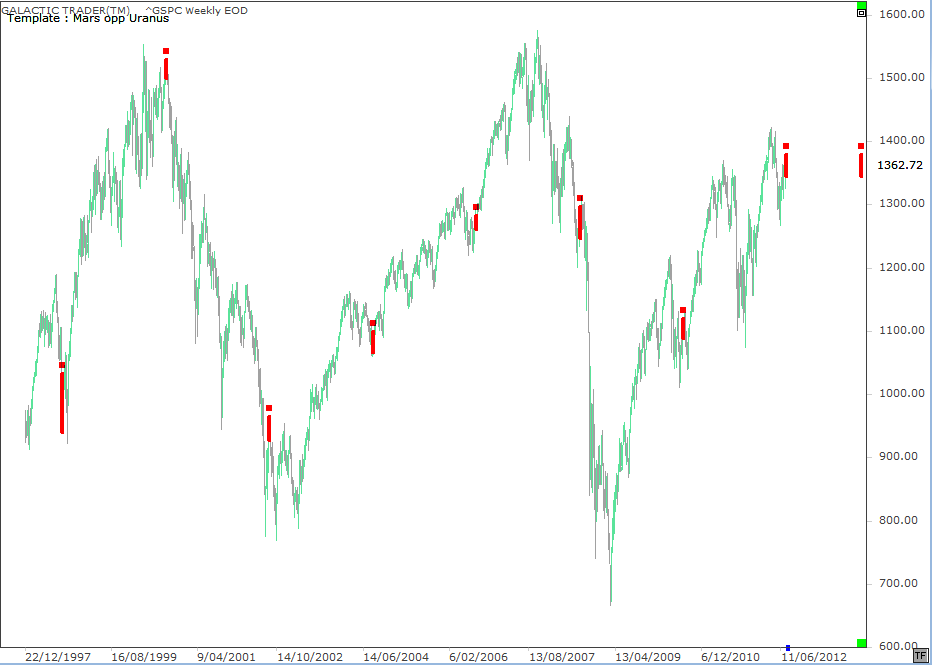
This is the 8th instance of the aspect since the late 1990s and the chart, a weekly, shows what happened to the SP500 in the weeks and months afterwards. There is a tendency for the aspect to occur near significant trend changes ... but they do NOT always bring on a crash cycle.
Four of the instances happened nearby significant rallies; three marked a timeframe near secondary peaks. Now let's have a look at some other charts for the index.
Before we do however, I'm going to have a little whinge and whine. I remain in an almost permanent state of frustration and bewilderment about how much TALK there is about the state of the Wall Street markets. They're not that interesting! They're not even all that bloody difficult!
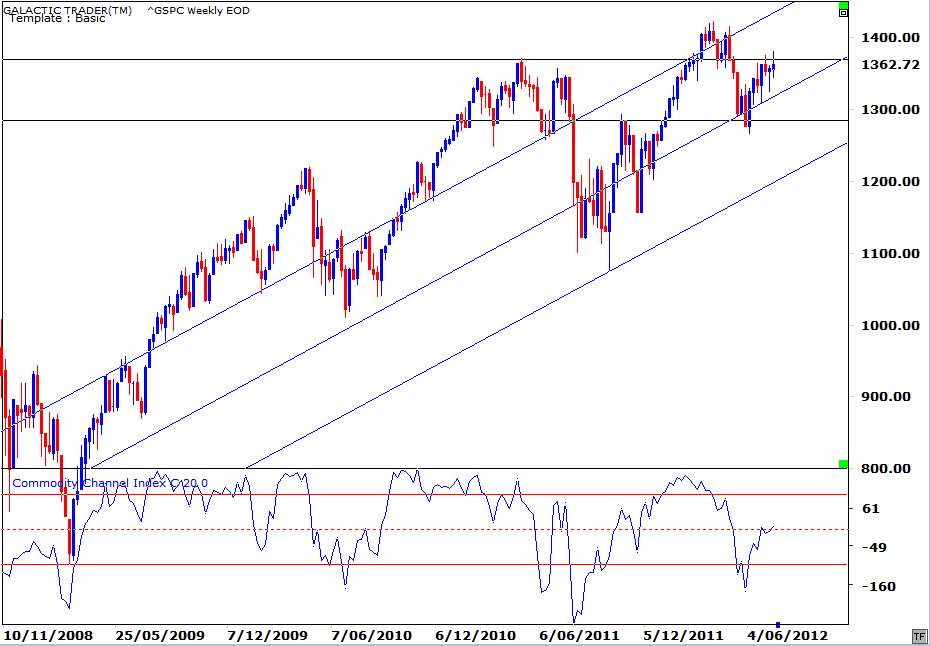
Where's the big deal? As we've discussed in past weeks ... there are only two lines of horizontal Support/Resistance that are currently important on this chart. The endless agonising and angst over the mindless blips on a daily chart and the intricate parsing of every breath Ben takes is just ... annoying. Superficial drivel.
Here's Polly's Weekly Planets chart. Is there anything on it worth more than 3 seconds of analysis?!
Here's Polly's Weekly Planets chart. Is there anything on it worth more than 3 seconds of analysis?!
When the bounceback began a few weeks ago, we constructed a daily chart with Fibonacci retracement levels - and expected the rally to run into trouble at the 1340s or 1360s.
And??
And??
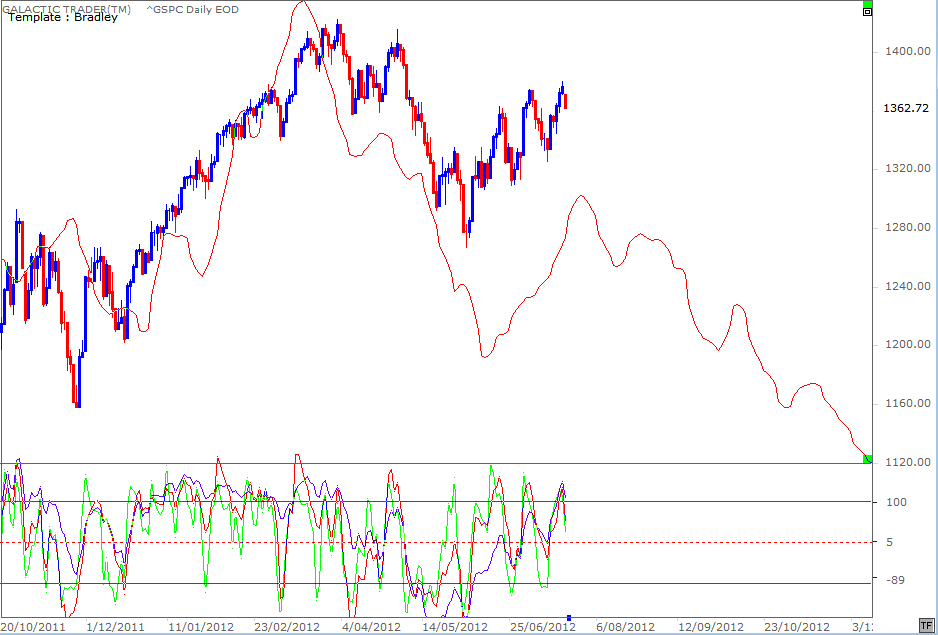
Let's begin this weekend with a review of how the SP500 has performed, so far, against the predicted Bradley turn dates for 2012.
Last week's breakout to 1380 wasn't really all that interesting ... unless one is totally obsessed by the bump-and-grind of the dailies and intradays. The week ended back at the early 1360s ... the MACD histograms continue to record negative divergence ... the FibRx levels continue to be hit ... and, so far, the uptrend angle is holding. As I said ... it's not that interesting, it's not that difficult and it's certainly not worth the amount of time, talk and effort so many people invest in it.
Okay, it had a wee little bit of an overshoot from where we thought there'd be significant resistance ... in a week with a high historical chance of a Merc Rx spurt, going into a major Mars-Uranus transit, and a timeframe I'd predicted as a probable major turn date.
Oh, there is a new marker on that chart I haven't shown in earlier versions. The dashed verticals are set at 30 calendar days. In the chapter on Time & Price in The Technical Section of the book, I make the point that trends tend to run in cyclical time periods which are usually linked to divisions of 30.
(This is actually not the case with the FTSE, which has a tendency to respond to another cyclical division.) Starting the count at the high on the chart above, we can see Pollyanna's decline took 60 days almost exactly. It then ran 30 days low-to-high (again only one day out of exactness). The next division in the 30 cycle took place on Thursday, at 45 days (1.5 of a cycle).
Now, speaking of the FTSE ...
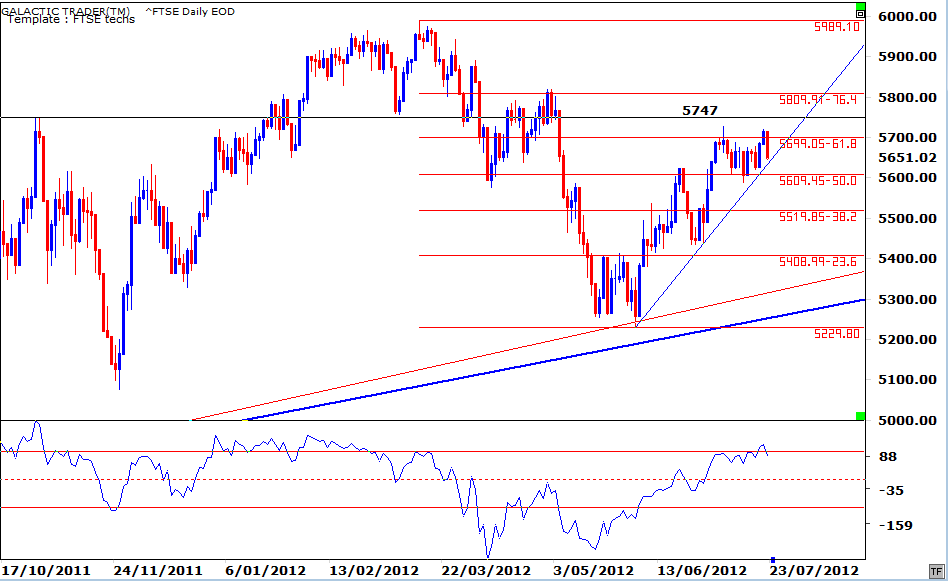
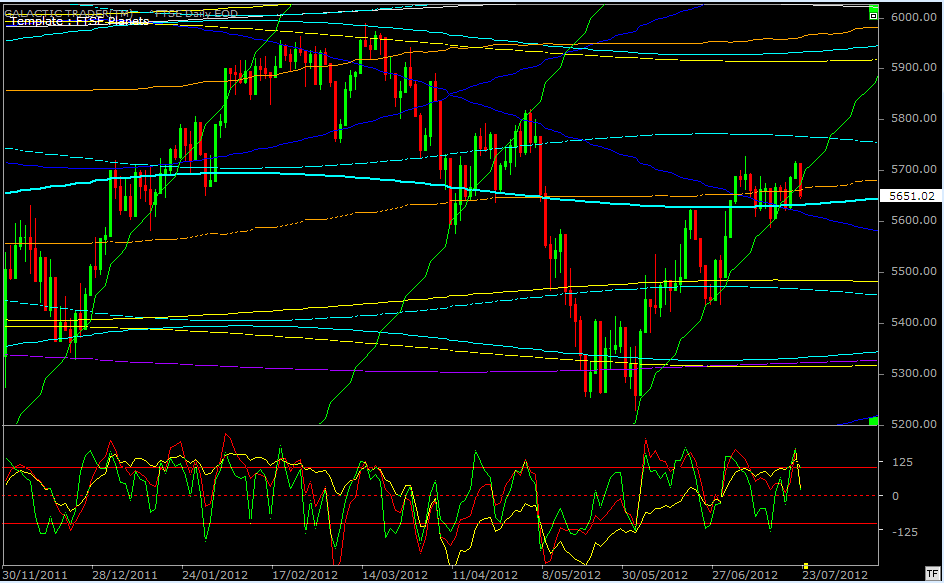
Unlike Miss Polly, The Vacuous Troll, the FTSE tends to be a little more rule-bound. In this case, the 50% and 618 Fib Rx levels have proven to be much tighter constraints ... and for quite some time now. So far, it is also still riding the uptrend angle. In fact, the FTSE has spent so much Time within these constraints, every day brings a higher chance of the index moving out of a Time phase and into a Price phase.
We've been keeping an eye on the above chart of the FTSE since the weekend before the low when I indicated this index had an historical tendency to attach itself to a rising Sun (green diagonal) line to launch into even short-term rallies. Friday's action brought the first Close below the rising Sun line since the rally launched.
It doesn't really much matter whether one uses the technical chart, or this planetary chart, the Support/Resistance levels and targets are obvious. Again, about 3 seconds of analysis/angst required.
Turning our attention now to Auntie, the ASX 200, the old bat finally awoke from her torpor last week and kicked up her heels.
It is important to keep in mind that the Bradley Model line marked in red on the chart above does NOT indicate either the direction of the turn, or its amplitude. The Bradley simply indicates when minor and major trend turns are likely.
Some years it is truly spooky in its accuracy; sometimes not so much.
With Pollyanna, we can see the price high for the year-so-far came just a little later than the Bradley prediction ... and that the bounceback rally started a little earlier than both my predicted date and the Bradley's. So far though, the overall pattern certainly seems to be following the script.
And that's potentially very important because we are heading into another major turn date at the end of the coming week - a period which coincides with the halfway mark of the Mercury Rx cycle I showed you last weekend.
Okay ... according to my Forecast 2012, markets should have topped out in March, turned in June ... and started another major trend turn last week. The major Bradley dates for the year are not too dissimilar - and after next weekend's Bradley, it does not see another significant trend change until mid-December.
Let me highlight that point ... if markets start turning down in the current timeframe, the Bradley predicts no major alteration to that trend until the end of the year. And I have forecast March was the top and from there it's a Bear until October at the earliest.
These predictions do go against the historical tendency for American markets to rise going into the US Presidential election cycle, so it's entirely possible I'm just plain wrong.
Let's take another look at what has tended to happen with the Mars opposite Uranus cycle, an aspect which became exact midway through last week as many indices were making new highs.


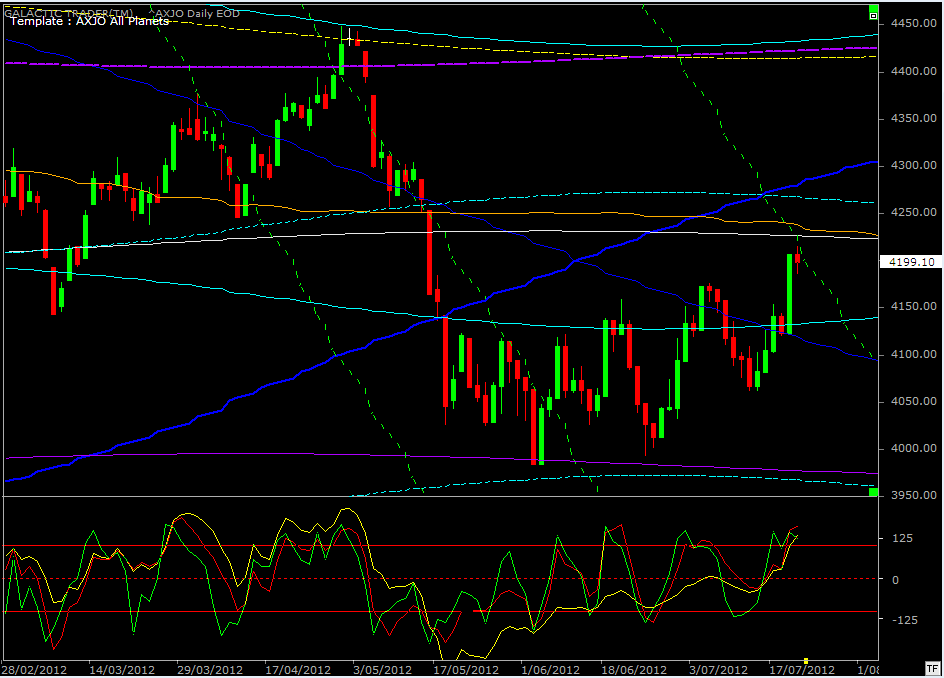
Now, while the old English dame has a habit of hitching a northbound ride on a rising Sun, Auntie has a rather distinct habit of doing an Icarus. On both previous occasions the ASX 200 rose into a falling Sun line, the rally suddenly died, even if only temporarily in the first example.
It does seem to matter, though, whether she is meeting other planetary resistance at the same time she meets up with the setting Sun. In the first instance, she peaked with a false break above a falling Jupiter (dark blue) ... and in the second example, she shot past the Sun line and got as far as Saturn and Uranus before dropping into a downtrend angle defined by the Sun line.
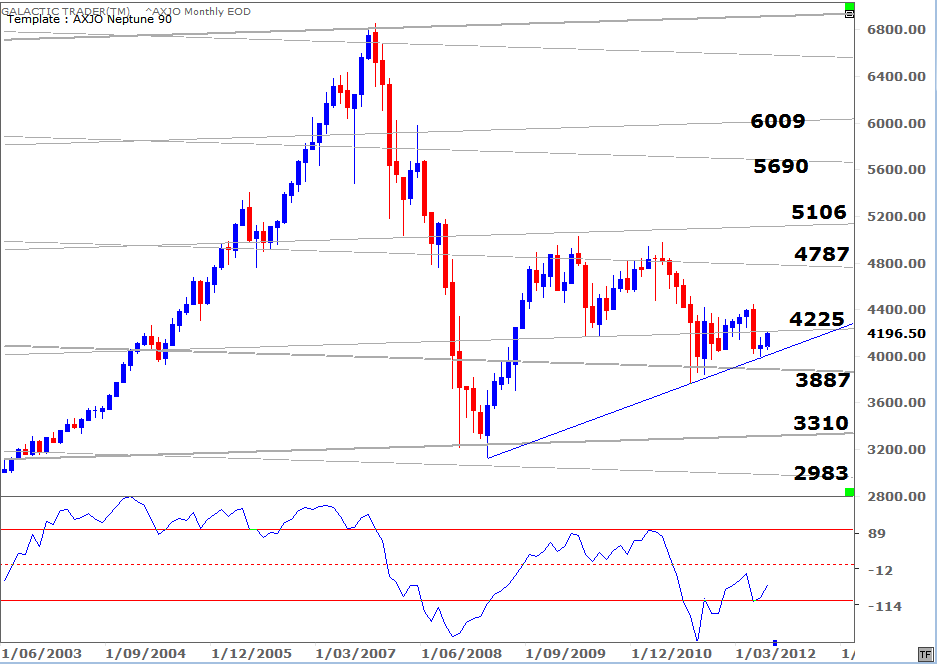
She has gone very, very close to touching a Neptune line (grey) and I'm actually surprised she hasn't given it a little kissy/smoochy.
Because, long-range, Auntie just lurvs Neptune.
Okay, we've been over quite a bit of territory. Yes, yes. I have, indeed, talked a lot! And that is the one thing I wish we could ALL avoid!
So, let's briefly revisit what is actually important. And that is ... markets are not really terribly interesting, unpredictable, or remarkable in any way. They TEND to stop and reverse very, very close to predetermined points - points you can mark ahead of time with hand-drawn trendlines or S/R levels, Fib levels, or planetary levels. It really does NOT matter which one you want to go with.
If you can shut out the endless noise, the news, the blogs, the emails, the blatherings of Ben ... you will start to see some fairly obvious - and safe - levels at which you can initiate a trade in a certain direction. It might not work out every single time. It just has to work out most of the time.
