Analysing the risk of a high speed U-turn
Week beginning July 16, 2012
High volatility is likely to continue in world stock markets over the next week ... with a higher-than-normal risk of a severe U-turn developing into the end of the month.
Copyright: Randall Ashbourne - 2011-2012
This weekend, we will examine the tendency of markets to go into a spurt-and-reverse cycle when the boy messenger of the Old Gods goes Rx. The retrograde movement of planets is an optical illusion. They never actually reverse course.
However, when viewed from the Earth, they sometimes seem to go backwards ... and as ancient astrologers watched the waltz of the planets, they added nuances to the symbolism of their interpretations. For example, if you happen to have Saturn Rx in your birth chart, there's a very, very strong chance your father will "go missing" by the time you reach your early teens.
Oh, I know that has nothing to do with financial astrology! But then, we both know you don't come peeking into the fortune teller's tent just to hear me waffle on about the dead Italian guy or whether the Canaries are croaking.
So, we're going to begin this week with a little look at The Trickster ... Mercury in Rx mode.
Uranus, one of the slow-moving planets, is now Retrograde again and it'll be joined this weekend by speedy Mercury.
In the coming week, Mars will square Pluto and oppose Uranus and I spent some time last weekend backtesting the reality of whether or not there's a reliable Mars-Uranus crash cycle.
In the coming week, Mars will square Pluto and oppose Uranus and I spent some time last weekend backtesting the reality of whether or not there's a reliable Mars-Uranus crash cycle.


Safe trading - RA
(Disclaimer: This article is not advice or a recommendation to trade stocks; it is merely educational material.)
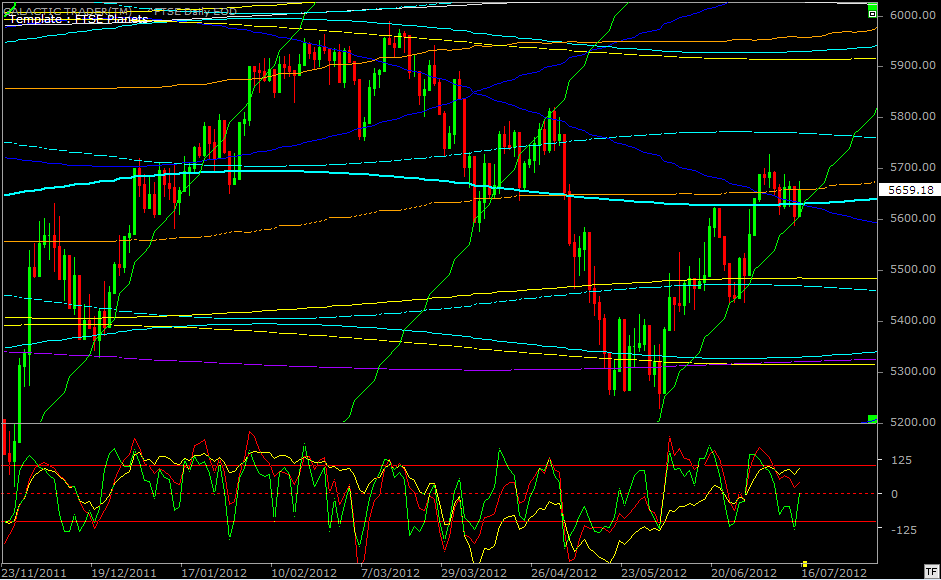
Yes ... it's the FTSE ... and yet another bounce from contact with the rising Sun line!! Spooky, indeed. How long will it last? GeeZeus, why are you asking me?!
Okay, we're starting to get increasing fade-out in the state of the green and red Canaries - the green one is short-term and the red is intermediate. The yellow bird, the long-range, is still okay. But, the internal strength of the rally is starting to wane.
That's the only daily we'll be looking at this week because I want to have a look at the big picture, especially with the high volatility implied by the Mercury Rx cycle and the Mars-Uranus potential for a crash cycle we went into last weekend.
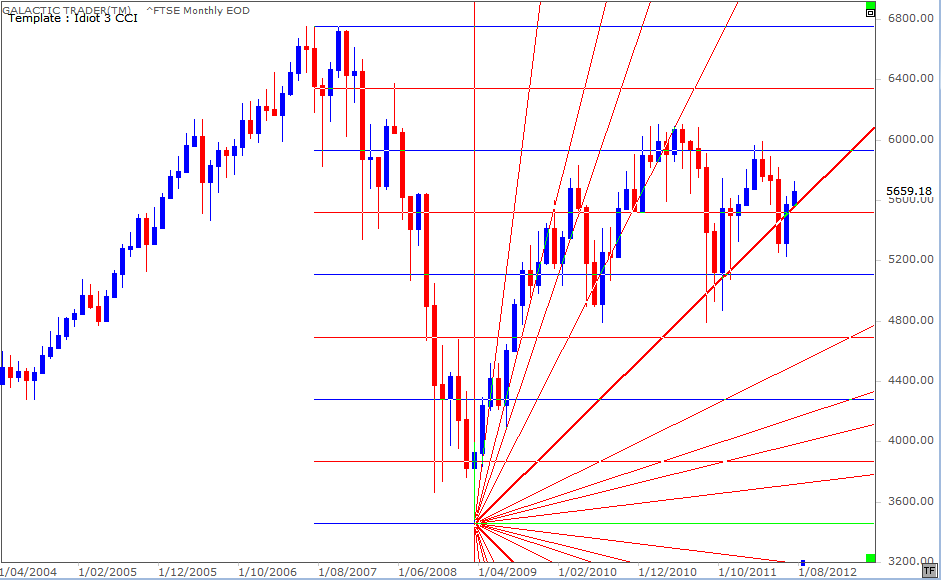
The chart above is a monthly Gann for the FTSE. She lost the primary Gann angle on a closing basis in May, but has regained it, though June ... and July so far ... have failed to recapture the totality of the earlier losses.
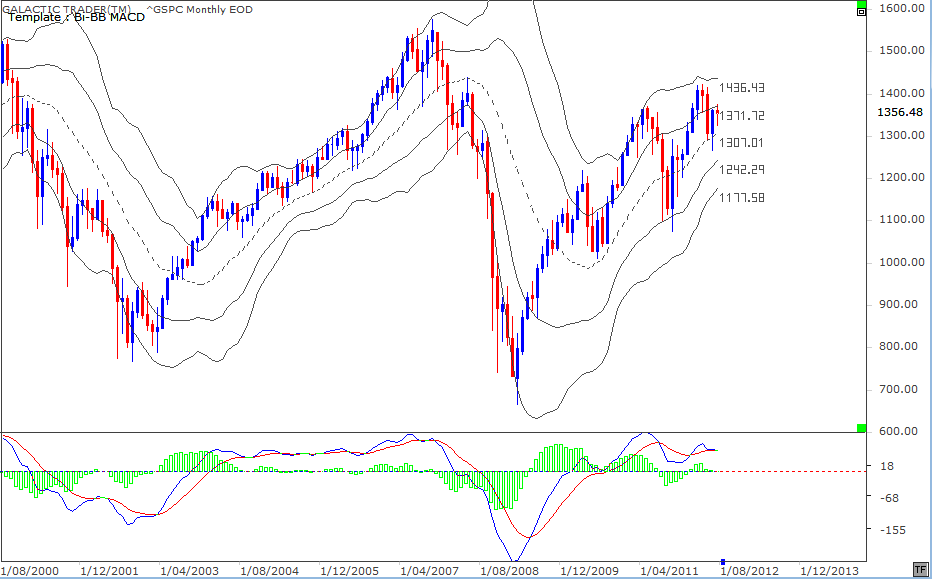
Turning our attention again to Pollyanna, the SP500, it has also failed to recapture the earlier losses. It is playing by the Bi-BB rules outlined in The Technical Section of the book.
I draw your attention to the three instances of negative divergence in the height of the fast MACD histograms, compounded at the price high by a lower peak in the MACD signal lines. The climate grows increasingly toxic, despite the hopes of a QE3 bailout from Ben.
I draw your attention to the three instances of negative divergence in the height of the fast MACD histograms, compounded at the price high by a lower peak in the MACD signal lines. The climate grows increasingly toxic, despite the hopes of a QE3 bailout from Ben.
Let me start with some background. The late Kaye Shinker, who was kind enough to review The Idiot & The Moon when I published it online a year ago, made a specific study of the Merc Rx impact on the Dow Jones Industrials and came to the conclusion that most of the time, the Dow would end the Merc Rx period with price within 1% of where it started the cycle.
To put this simply ... on August 8, the price of the DJI should be within 1% of where it closed last week.
Ray Merriman, the guru of financial astrologers, has noted a tendency for stock markets to start a move at the Rx date and then reverse course halfway through the cycle; which is just a variation on Kaye's findings.
Now, I guess if I were an American, I'd probably be from Missouri; IF my memory serves me correctly, that's the "don't tell me, SHOW me" State.
So, I'll show you.
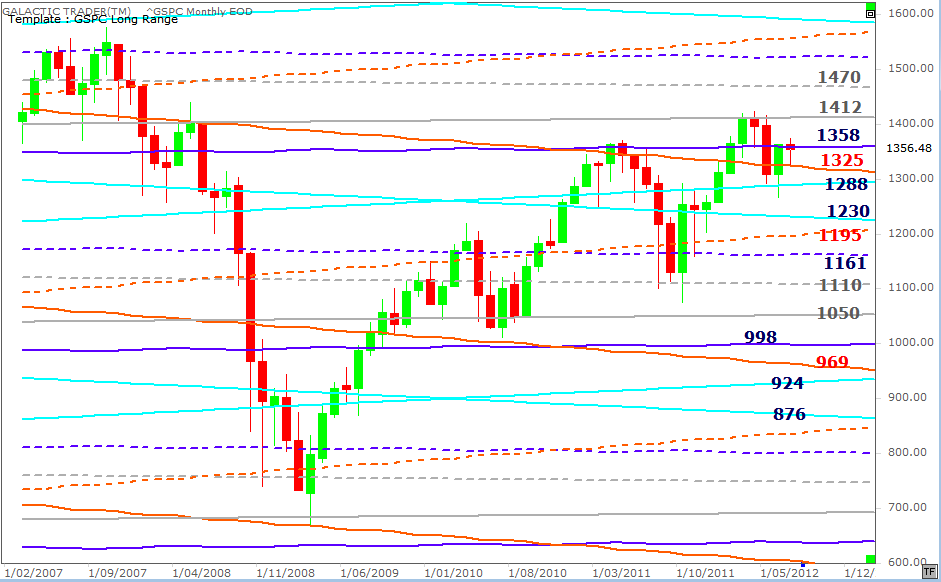
Last week's decline stopped on contact with the 1325 long-range Node target and bounced back to finish near the Pluto line at 1358.
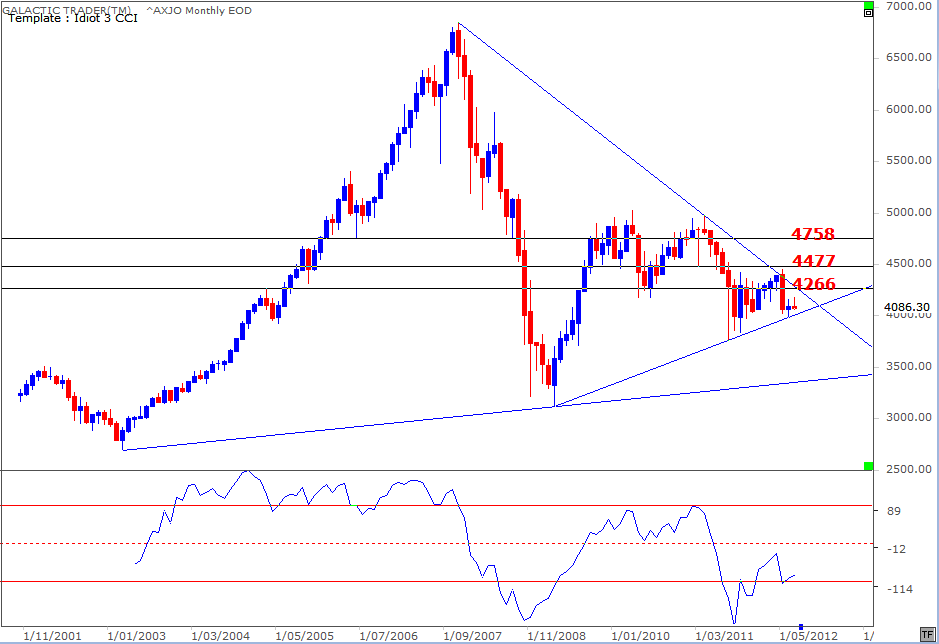
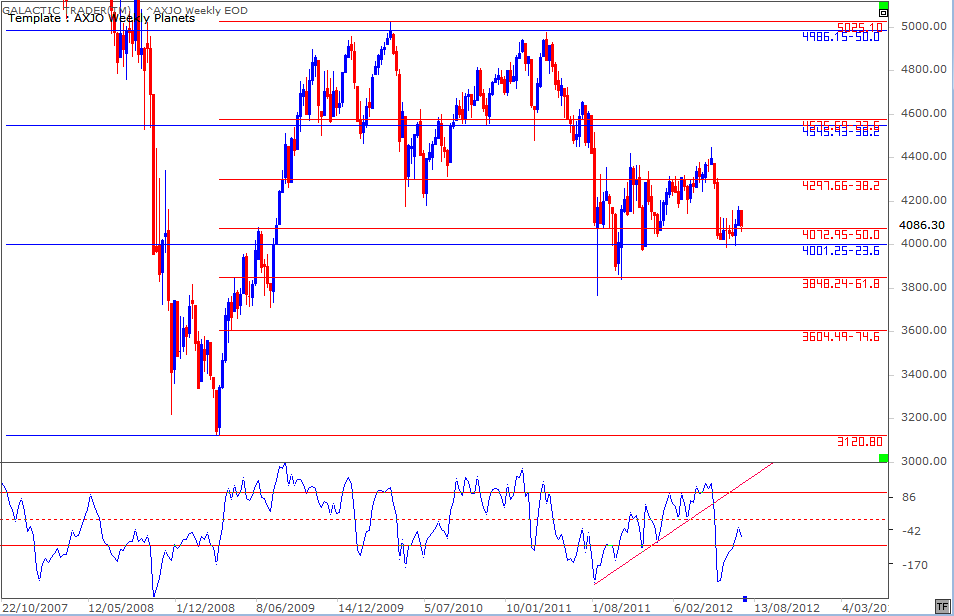
The ASX 200 has recovered about two-tenths-of-bugger-all of the May plunge. The extremely small range consolidation over June and July-to-date is either extremely Bullish or unbelievably Bearish. I have a very strong leaning towards the latter scenario. The depth of the long-range Canary plunge last August and the index's extremely weak recovery ... in an economy supposed to be one of the strongest in the Western world ... suggest things could get really ugly, really fast.
I've mentioned a couple of times recently the importance of the 50% retracement levels. The blue Fibonacci lines are the range of the 2007-2009 plunge and the red ones are the Rx levels for the 2009-2010 recovery rally.
As y'can see, the post-plunge recovery stalled out at a 50% Rx ... and last week found Support at the 50% level of the smaller range.
Okay, that's the show for this week, folks! At some stage, hopefully within the next week or so, I'll write a new piece for the Articles section of the site dealing with how to use The Idiot and a couple of really basic techie tools to trade intraday charts.
In the meantime ...
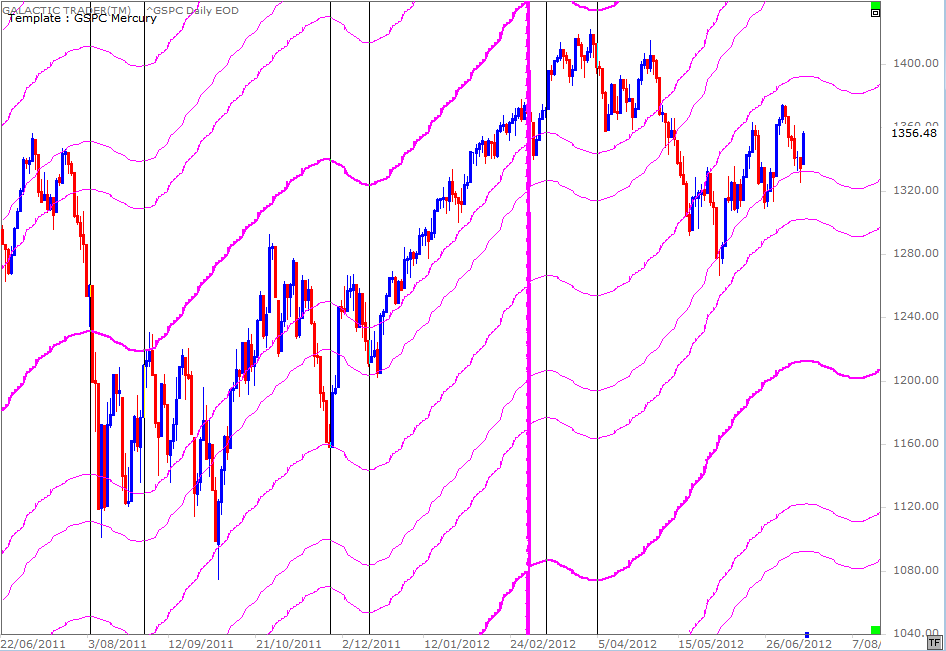
There's a lot to absorb from the chart above, but firstly let me apologise for that irritating thick, pink vertical; it's a glitch in the software that occurs when a planet enters Aries. Please try to ignore it.
Okay, so this is a daily chart of the SP500 and it's obvious the index has a general tendency to travel within Mercurial corridors and finds either Support or Resistance when it meets up with the planetary price lines.
The retrograde periods begin when the pink lines stop rising and start dropping for a few weeks, before resuming their upward direction ... which is the shift from Rx to Direct again.
I've inserted black verticals at both the Rx and Direct dates. If you look closely at the three most recent instances, it's fairly easy to see what Kaye and Ray talked about. In the first example to the left of the chart, the index was dropping already, but continued the drop before bouncing roughly halfway through. By the time of the second black line for that cycle, price had climbed back very near to the bar marked by the very first black vertical.
In the second instance, the Merc Rx date produced a strong rebound ... changed direction about halfway through ... and then began climbing again after Mercury Direct.
The effect isn't quite as obvious in the third instance, but it is true that the price of the index at the second black line of the cycle was pretty damn close to where it was at the first vertical.
So, what does it all portend, eh? Well, as I said earlier ... a higher-than-normal chance of a spurt-and-reverse ... either a rally or a decline which goes high-speed into a U-turn halfway through the cycle, which means around July 27.
Okay, so that's the "show me" part. Now let me deal with some other astrological stuff about Mercury Rx. Some astrologers warn against trading during this period; others will tell you that the technical read-outs will give an abnormal number of "false" signals. I'm not one of them.
Mercury goes Rx for a few weeks at a time three or four times a year. I don't know about you, but I think life is too short to spend a quarter of the year sitting on your butt worrying and doing nothing because some pissant rock appears to be going backwards.
My real-life experience of Mercury Rx is this ... YOU make mistakes. And, usually, because you're not concentrating. I've learned over the years that the worst that happens is that I occasionally hit the bloody Buy button when I meant to hit the Sell. So, double-check everything you do for the next few weeks and make sure you actually did what you intended to do. And the chances are you'll get through the cycle totally unscathed.
Now, I guess I could tell you that's the end of The Spooky Stuff for this week ... but ... cue the X Files theme music, please ...
