
An in-depth examination of the TSX60
Week beginning January 30, 2012
Now, now ... don't go getting your winter woollies in a twist. We will be looking at the precious Pollyanna - and the FTSE and ASX.
Copyright: Randall Ashbourne - 2011-2012
The heading on this weekend's edition is so they'll be able to find it easily once it's filed away in the Archives.
Well, let's get down to business, eh? Wall Street is showing distinct signs of topping, at least temporarily. Miss Pollyanna, the SP500, is starting to fall off the sharpest of her too far/too fast trendlines.
At least 17 of the 30 Dow components are failing to endorse the DJIA's small break of the previous High; some of those which have, are showing gaps and could leave an island behind; and there are at least some signs the big index may have overstepped the mark with a false break high.
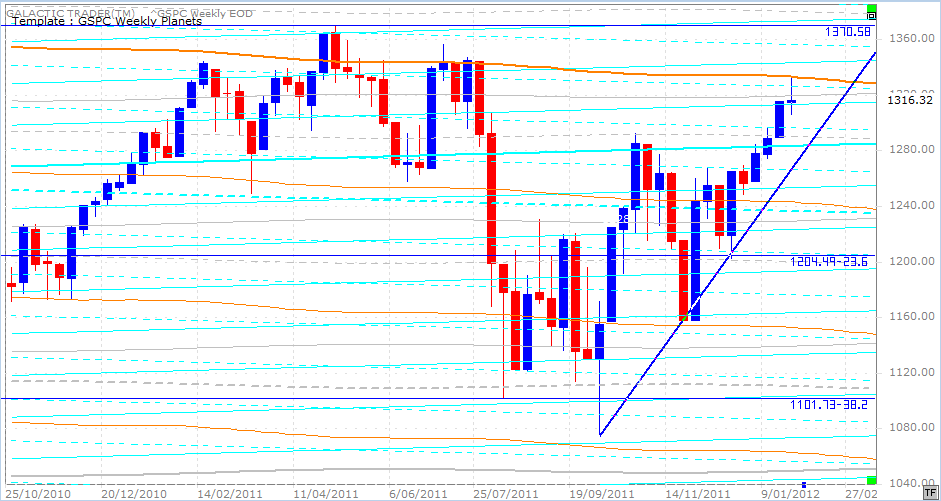
Pollyanna has hit, and resiled from, one of the strongest of the very long-range planetary price markers which have significant impact as both Support and Resistance barriers.
Unless there's a Black Swan ready to take flight however, there does not yet appear to be sufficient negative divergence in the oscillators to warn of a death dive.
Those of you who've absorbed the material in Forecast 2012 will know the current position of Jupiter allows the recovery run to last into early March ... but that we are already within the period where an historical tendency to go into a significant decline comes into play.
I did warn you that this year the Sarah Palin/Charlie Sheen of stock indices would occasionally have to play 2nd fiddle while I delved more deeply into The Spooky Stuff affecting other indices.
And the Canadians have been sooo nice and polite, waiting their turn.
And the Canadians have been sooo nice and polite, waiting their turn.


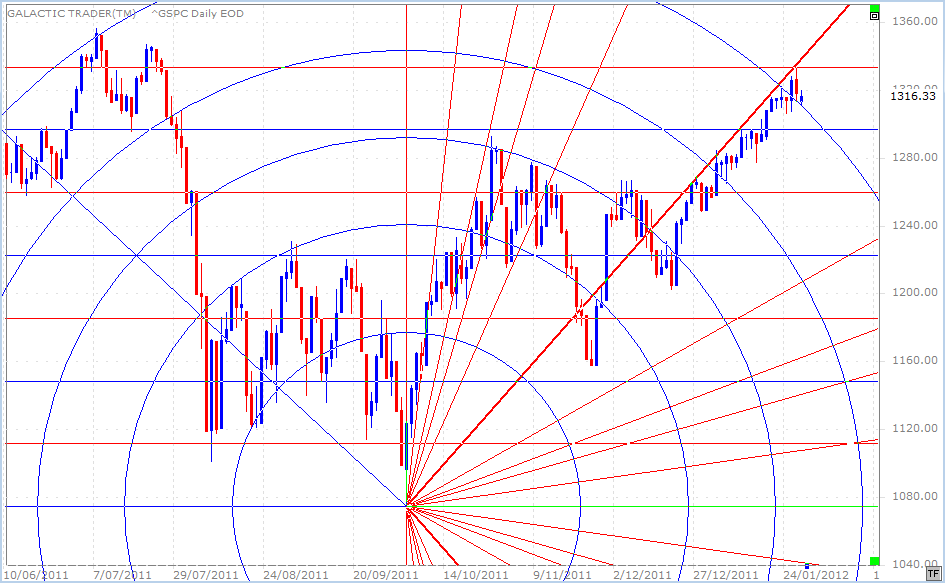
We'll begin by taking a look at a Gann indicators chart of the 500, updated from last weekend.
Explaining the omens of this chart last weekend, I said:
"The next highest Gann price division sits at 1333 and is the target for January 26 - if price keeps smooching the underside of the rising primary angle. Of course, it first has to make it through the resistance of the Fibonacci arc early this week."
That goal was hit with a price of 1333.47 right on cue, on January 26.
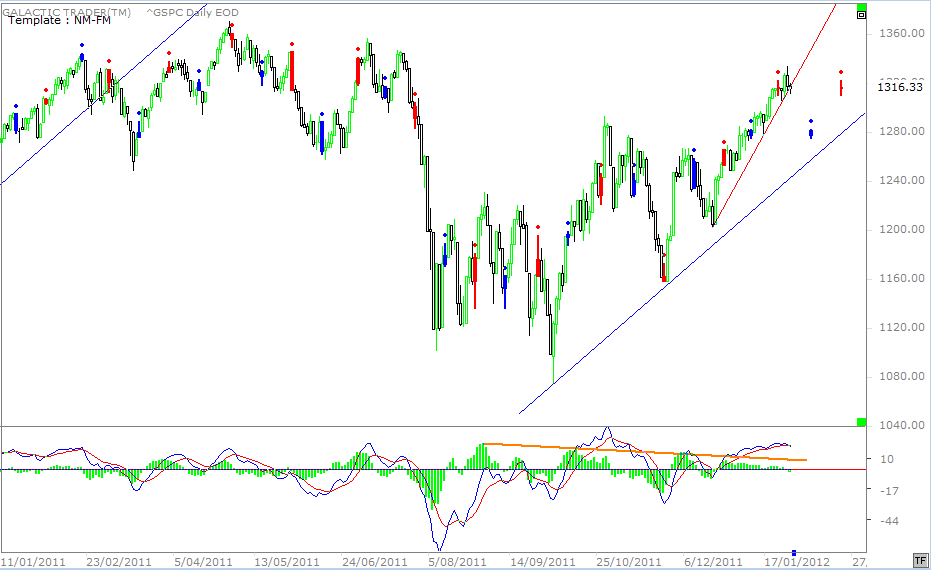
We also took a look last weekend at the New Moon/Full Moon chart for Pollyanna, since the week kicked off with a New Moon in Aquarius and a statistical high tends to form within a couple of days either side of a New Moon, with sideways to downwards pressure developing into the next Full Moon.
The red bars are New Moons, with red indicating a potential downturn from that point and the Full Moons are blue, indicating a potential to turn higher. You'll know from The Moods of The Moon chapter that it's a long-range tendency, prone to failure under certain technical conditions.
However, if the lunar phases are back in "normal" mode, this would be an appropriate time to see a pullback in the pattern, which seems to need an interim downleg, followed by a final rally and topping process to complete.
The "obvious" Support levels are the highs of last October and December - 1292 and 1267. Technically, 1267 should not be breached in a pullback here and would be a sign of danger that the expected pattern is morphing into the dreaded "something else". A sign of further strength ahead would be if the decline stops and starts consolidating on top of the last consolidation at 1296.
Polly's Weekly Planets chart is above and the sharp backing off from the North Node line is obvious. I've detailed the singular importance of that particular line in Forecast 2012. This chart has the planetary lines set at a closer level than the PWP chart I normally show.
You can work out the current price levels from the earlier bars. We can see 3 levels of potential planetary support from 1284 to 1296, as well as trendline support starting to come into play only a tad below that for the week ahead.
Turning now to the FTSE ...
You can work out the current price levels from the earlier bars. We can see 3 levels of potential planetary support from 1284 to 1296, as well as trendline support starting to come into play only a tad below that for the week ahead.
Turning now to the FTSE ...
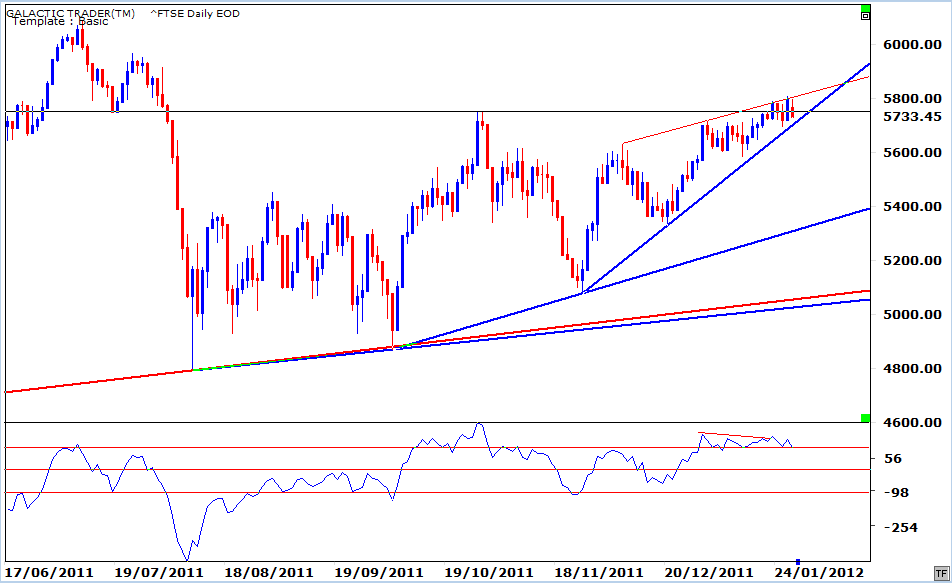
If you remember this chart from last week, I made the point that the FTSE was then making what looked like a technical double-top, with divergence in the oscillator. However, I also showed a planetary chart indicating things might not be what they seemed because while the previous peak had stopped below a set of planetary lines, the FTSE was last week actually on top of those planets and following a rising Sun line.
I'll return to that in a moment, but just before I do ... the FTSE appears to be making a pattern known as an ending diagonal. The tops are contained by a shallow trendline, with bottoms forming on (or slightly above) a sharper, rising diagonal. The usual tendency is for a breakdown, rather than a breakout, as price continues to be pressured into a narrow range ... which forces a sharp move once the container is punctured.
I'll return to that in a moment, but just before I do ... the FTSE appears to be making a pattern known as an ending diagonal. The tops are contained by a shallow trendline, with bottoms forming on (or slightly above) a sharper, rising diagonal. The usual tendency is for a breakdown, rather than a breakout, as price continues to be pressured into a narrow range ... which forces a sharp move once the container is punctured.
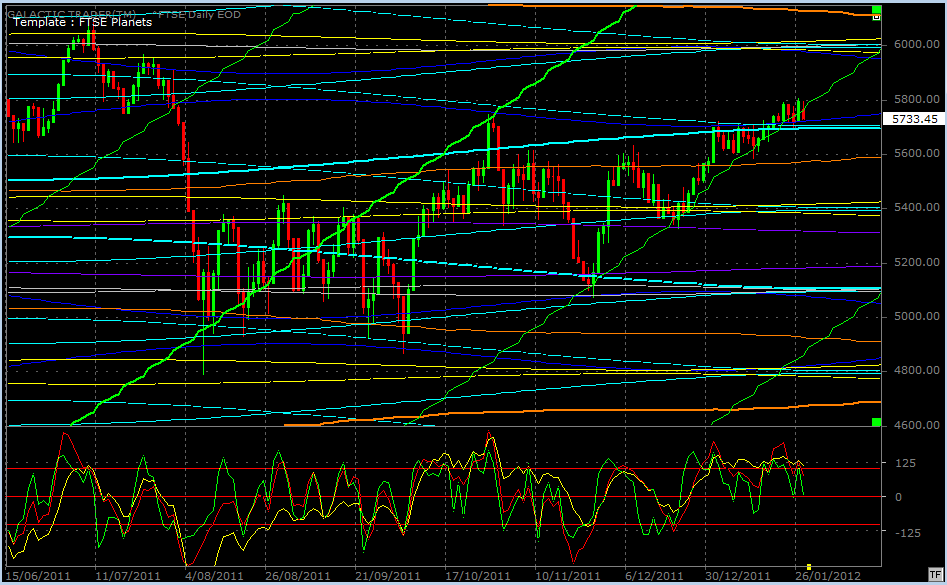
Above is the update of the FTSE planetary chart I showed last week, when I suspected there'd be a break above the technical double-top. The power of the rising Sun line (green) is now starting to wane.
For the first time since this rally leg started in late November, price is starting to close below the line. There have been some temporary blips below the line before, but no closes ... now we've had 2 in the past week. As we can see, there's a nest of technical and planetary support in the early 5700s, but once it's broken there's nothing to stop the drop until 5572.
Thursday's price peak arrived with all 3 of The Canaries in disagreement with the optimism.
However, one of the reasons I suspect a pullback now is likely to be only short-lived in the absence of any Black Swans is that the negative divergence showing up in daily charts is not yet evident in the weeklies.
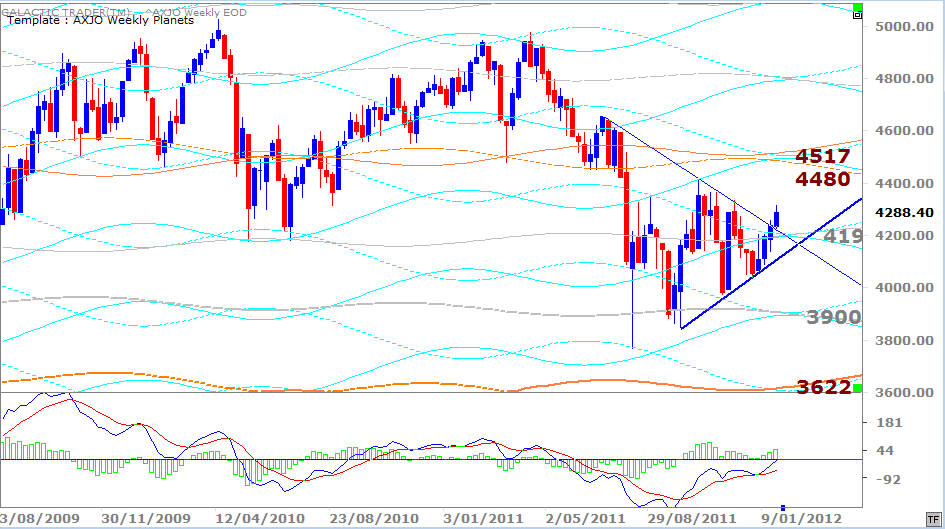
Above is Auntie's Weekly Planets ... the ASX200 ... and the fast MACD is quite happy and content with the rally. And that tends to be the case with almost all the major stock indices I watch.
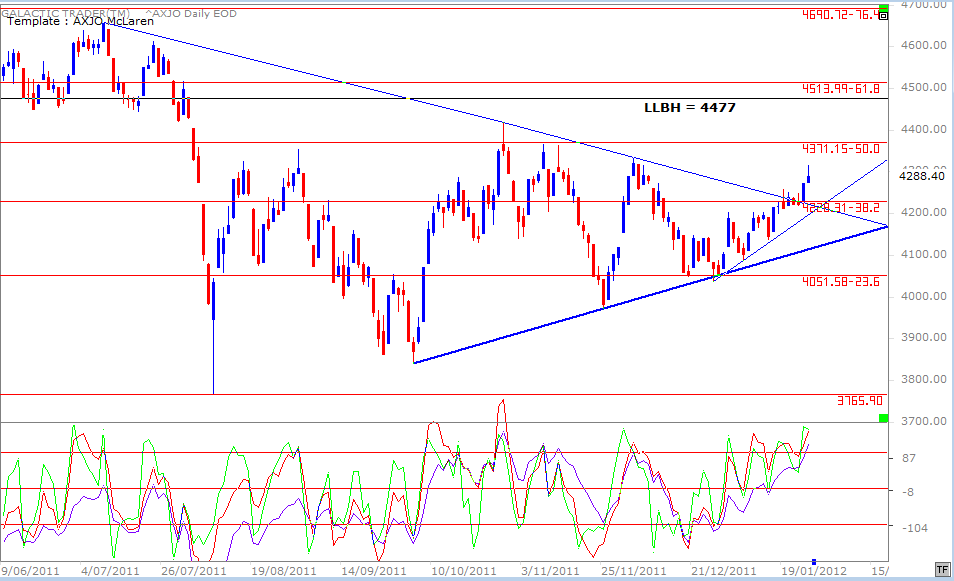
The 200 has broken northbound from a triangle, with considerable planetary support centred either side of the 4198 level. Let's take a quick look at the daily.
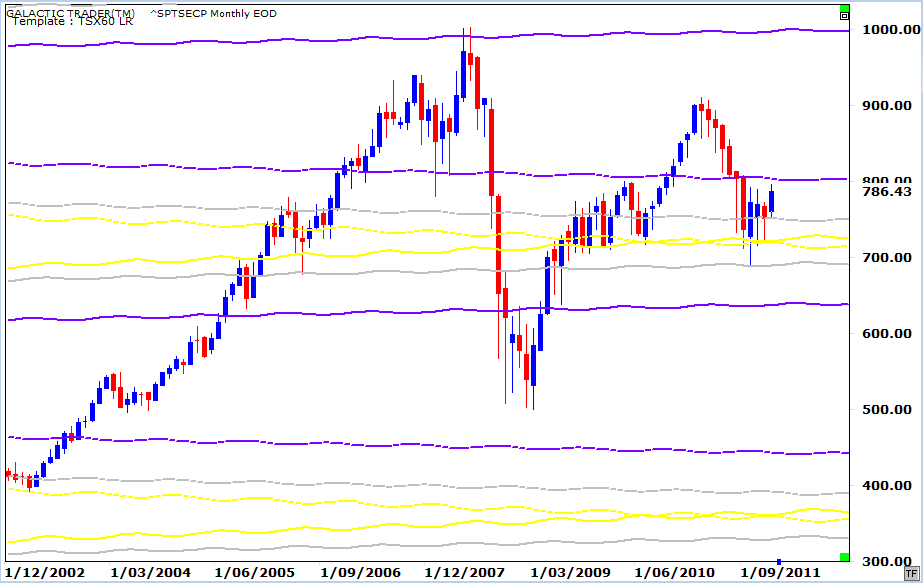
The dark Lord of the Underworld, Pluto, is the main long-range Old God who keeps the TSX60's price moves under lock-and-key ... with some interim-move assistance from the weirdo, Uranus, and from Neptune.
These lines are placed at their widest levels - 360 degrees - and only the blind and the infidel non-believers won't be able to see the significance.
These lines are placed at their widest levels - 360 degrees - and only the blind and the infidel non-believers won't be able to see the significance.
Safe trading - RA
(Disclaimer: This article is not advice or a recommendation to trade stocks; it is merely educational material.)
When we left this chart last weekend, Auntie was still trapped by the downtrend line, trying to hold at the 382 Fibonaci level ... and, importantly, with full endorsement from the long-range Canary - even though the red and green ones were showing a bit of ambivalence.
The breakout has been confirmed by all 3. So, overall, the omens of the charts point towards only a temporary pullback rather than anything more dire.
Now, as promised, something to warm the moose moss marshmallows of those North Americans far too polite to make a fuss over something as trivial as a tax on tea.
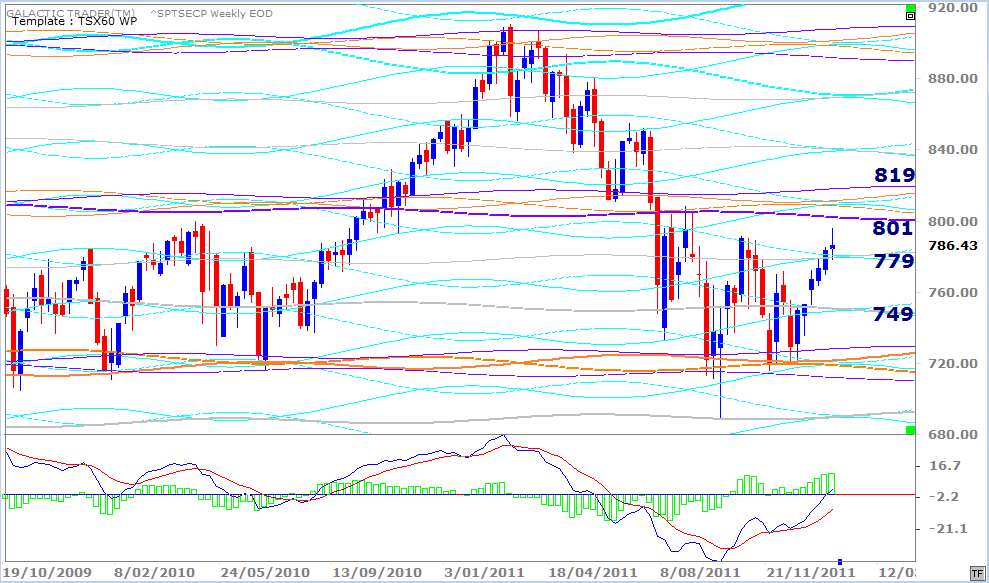
Now, while we use the long-range planetary chart for an overview of the forest as a whole, we can also create a TSX Weekly Planets chart to help determine where intermediate rallies and declines will find their stalling points.
So we decrease the zodiacal range for the three major Old Gods and throw Saturn into the mix because he's the God of Restrictions (and boundaries and Time). And, like a typical Capricorn, he's utterly convinced He Knows Best.
And abracadabra, lo-and-behold ... we have an extremely useful chart, as we do for Pollyanna, Auntie and the FTSE, for determining some excellent, safe and very profitable Entry and Exit points to ride intermediate-term rallies and declines.
Those of you south of the lakes can call Mitt for advice on Cayman or Canary accounts so you can trade the TSX - to keep your money safe from the guy who thinks the way to solve the mortgage crisis is to build MacMansions on the Moon. No Newt axes.
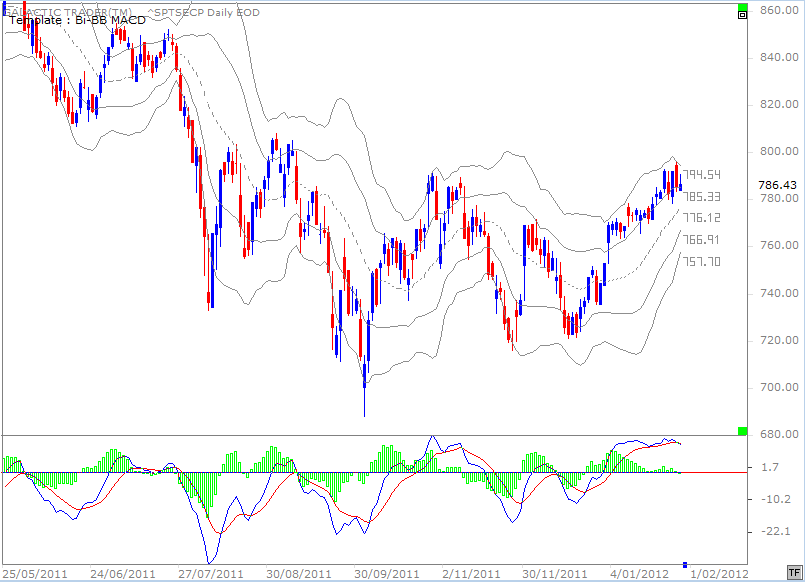
On a daily chart, the TSX60 is ringing a lot of alarm bells ... rapidly-contracting BBs, dropping MACD histograms which have just slipped below the Zero line, a MACD signal line also going negative.
Do I need to harp and nag? Might as well ... what's a Virgo Moon for, if not for that, eh? Look at the forest FIRST ... use the weeklies to determine the probable price targets up or down ... and only then study the dailies to find out if the current trend is ailing or still strong so you can put your boodle to use.
Do I need to harp and nag? Might as well ... what's a Virgo Moon for, if not for that, eh? Look at the forest FIRST ... use the weeklies to determine the probable price targets up or down ... and only then study the dailies to find out if the current trend is ailing or still strong so you can put your boodle to use.
