The blow-off rally faces New Moon test
Week beginning January 23, 2012
Wall Street and some other indices have been rising in a three-trendline rally suggestive of a blow-off.
Copyright: Randall Ashbourne - 2011-2012
Nor has any significant negative divergence shown up in the oscillators to warn the rally is about to fall in a huge hole.
As most of you know, I have indicated for months that the downturn could be delayed until early March - and Forecast 2012 deals with the reasons for that in considerable detail.
The type of rally now underway in Pollyanna, the SP500, normally requires a late exhaustion surge to finish the pattern.
However, it will face a test in the week ahead as we go past the statistical high of a New Moon, the Sun completes a square to both Saturn and Jupiter (which was discussed in last weekend's edition), and Mars, the planet we associate with drive and energy, goes Retrograde.
There are many analysts now predicting that Wall Street has launched itself into a full Bull pattern. Without going into the interminable intricacies of Elliott Wave theory and practice, that's very unlikely. Markets cannot be in a Wave 5 - because the August/October plunge they're sticking Wave 4 labels on, went deep, deep inside Wave 1.
Applying the same count to the ASX200, the purported Wave 4 actually went lower than Wave 2. Their count is nonsense.
So far, the daily price moves have lacked the sort of big bar intervention so evident on December 20, November 30 and during the first bounces out of the August/October Lows.
And that's the danger to Short positions. This type of rally can be sustained for a long time, even in the absence of retail buyers.
And that's the danger to Short positions. This type of rally can be sustained for a long time, even in the absence of retail buyers.


Under the Bull counts currently being promoted, the SP500 is now underway to a potential topping in the early 1400s. In Forecast 2012, I've used Pollyanna's long-range planetary charts to give the likely potential targets before this falls over.
Let's begin the analysis this weekend by having a tech-heads' look at Pollyanna's weekly.
Let's begin the analysis this weekend by having a tech-heads' look at Pollyanna's weekly.
Three things are obvious: 1. Price has broken above the downtrend line. 2. The rally angle from the October Low is strong and is still holding. 3. There is absolutely no disagreement from the oscillator that the rally is legitimate.
Now, since we do not get married to an expectation of what should happen, there is a 4th element to this chart which supports the very Bullish argument - and that is the post-October recovery has rebounded an unusually large amount of price for what should be a Bear market rebound.
So, let's see if that strength is endorsed by the daily chart.
The chart above has a number of Gann elements.
* The red angles are a Gann fan. In the immediate bounce from October, price rose on the 3 sharpest angles and the current upleg is rising on the underside of the primary Gann 1X1 angle.
* The blue arcs are Fibonacci-calculated to both Price and Time
* And the alternating blue and red horizontals are Gann price divisions calculated from the top in early 2011 into the October bottom.
The next highest Gann price division sits at 1333 and is the target for January 26 - if price keeps smooching the underside of the rising primary angle. Of course, it first has to make it through the resistance of the Fibonacci arc early this week.
The week starts with a New Moon in Aquarius, the sign which has rulership over stock markets - and there is a statistical tendency for optimism to peak a couple of days either side of a New Moon.
In the chart above, New Moons are the red bars with a dot-on-top, Full Moons are the blue bars. The reason for that is simple ... New Moons are highs and price should start to stagnate or decline (red is the warning); Full Moons tend to be a low point, so the bars are blue to signal a potential, positive turning point.
Price has actually been rallying since before December's New Moon and is still rallying towards this week's New Moon. Don't worry that the red bar is sitting way below the current price action; the software doesn't predict the market, so it just locates future NM/FM bars at the previous NM/FM level.
There is potential for a stall to the rally from early this week, based on nothing more than statistical lunar phase "norms". And the potential is enhanced by some non-obvious divergence. While the MACD signal lines are okay, the height of the histograms has been steadily falling away since peaking at the end of last August ... and the divergence is particularly obvious since the December New Moon; price has been rising, but the histograms have been dropping.
Let's turn our attention to the FTSE.
This is an update of a technical chart I used in last weekend's edition - and if you missed that report and are interested in trading London's main index, it's worth reading because I detailed the main planetary markers.
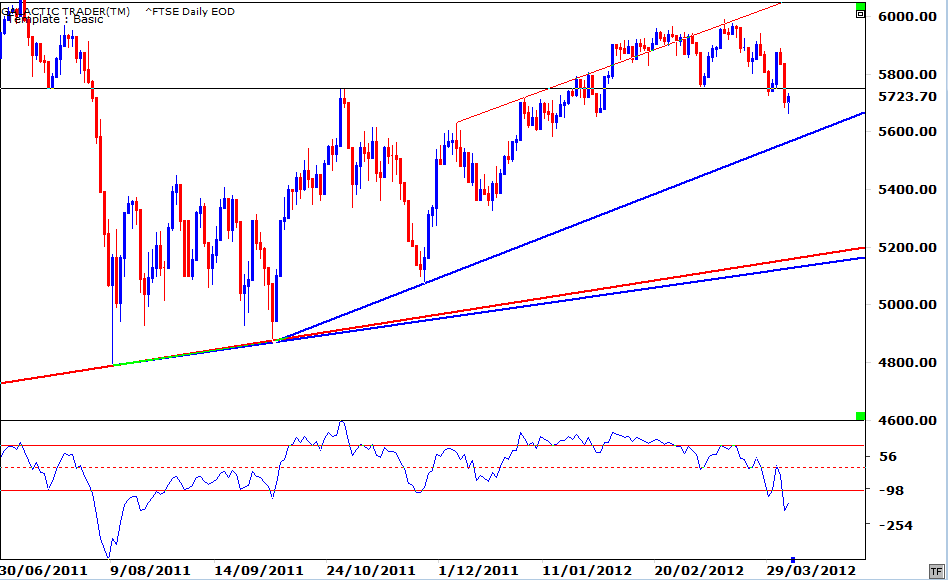
For the moment though, we're interested in the technical side of things. At immediate glance, the index is in danger of double-topping with a small degree of negative divergence in the Canary oscillator. We can see the three, rising trendlines at a glance and know the index is currently in blow-off mode.
But, nothing is ever a clear-cut guarantee. While that is a technical double-top potentially at play, The Spooky Stuff warns against taking the techie stuff for granted. Last weekend, I showed the details of my FTSE Weekly Planets chart. We'll now have a look at a daily variation of that theme.
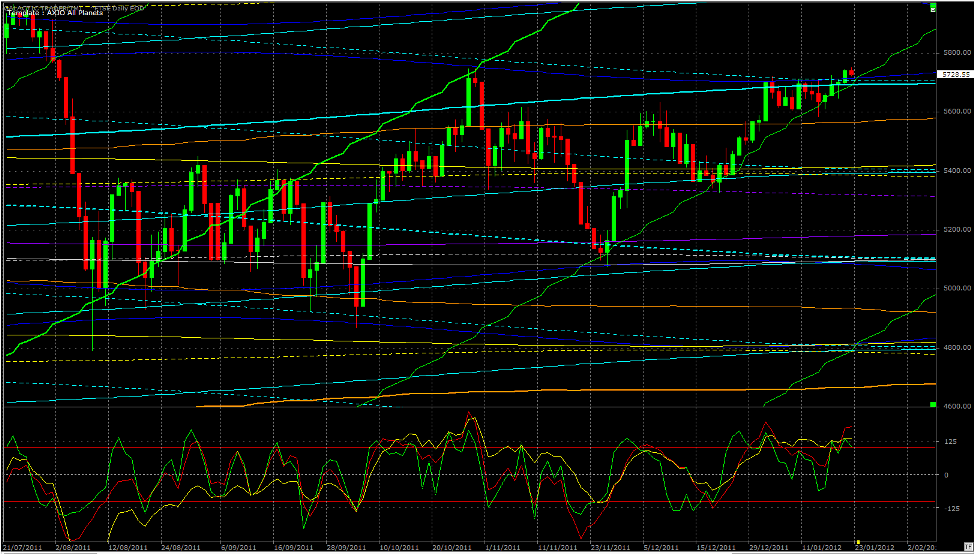
If we view the late October recovery top in terms of the planetary price bars, we can see the rally was stopped when price knocked its head against a rising (green) Sun line and a basically-horizontal Jupiter line. Now, the current circumstance is that the FTSE has been rising on top of a rising Sun line and, after 12 days of bumping its head, has actually managed to close above the resistance of Jupiter/Saturn lines.
Clearly then, we would want to see some hard evidence of a price drop below that resistance before a Short play could be deemed safe even in the near-term negativity of a New Moon peak, with the "drive" planet going into reverse from a geocentric viewpoint.
Clearly then, we would want to see some hard evidence of a price drop below that resistance before a Short play could be deemed safe even in the near-term negativity of a New Moon peak, with the "drive" planet going into reverse from a geocentric viewpoint.
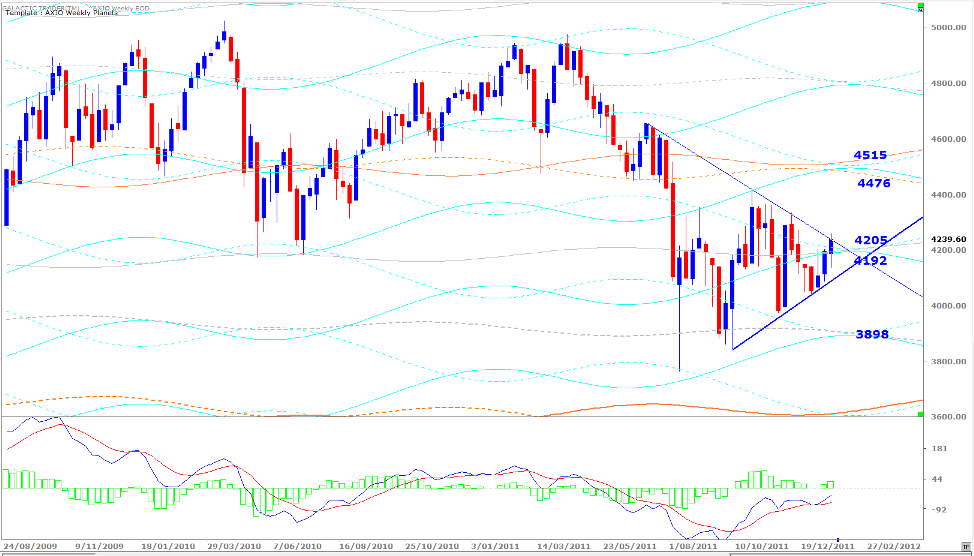
Auntie's Weekly Planets chart (ASX200) is above. After a hard-down Monday, the index recovered to have another attempt at bursting above the long-range Neptune resistance, doubly enforced by Saturn, which had topped out price during the previous couple of weeks.
It's a positive sign, especially since there is no negative divergence in the MACD. The real test, however, will be whether the index can also break free of that falling downtrend line.
Let's take a look at the daily chart, rather than the Weekly Planets, to see what the omens portend.
It's a positive sign, especially since there is no negative divergence in the MACD. The real test, however, will be whether the index can also break free of that falling downtrend line.
Let's take a look at the daily chart, rather than the Weekly Planets, to see what the omens portend.
In Forecast 2012 I have given both the major and minor turning dates calculated by the Bradley Model for the coming year, along with the tweaked readings from Yuri Shramenko.
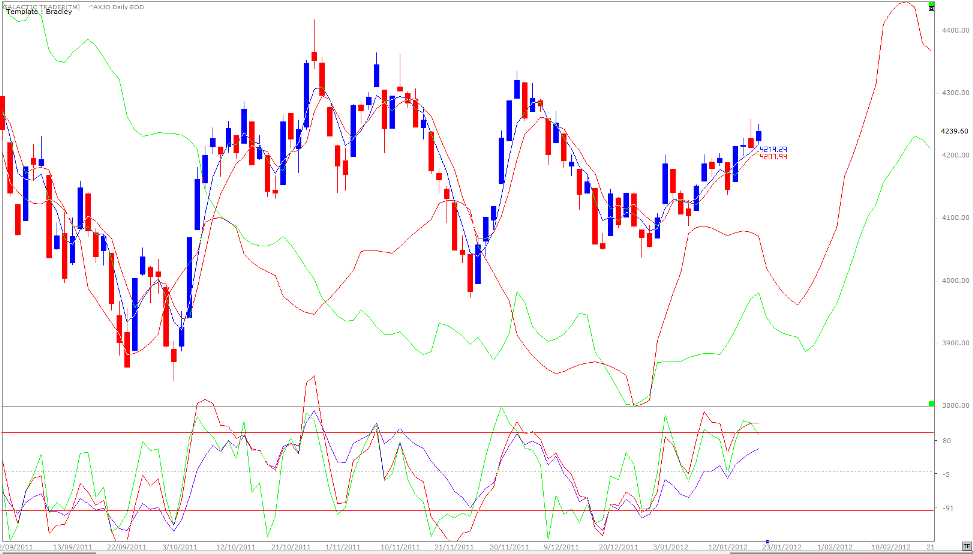
The last major turning date for 2011 was listed as December 28. Auntie put in a bottom on December 29 and has been rising since. The chart above shows a near-term change in that major movement starting on Friday ... and due to turn again late this month.
Overall then ... Wall Street and the FTSE are currently in blow-off mode and Pollyanna has not been showing the big blue bar manipulation so obvious in the previous rallies. There are clear signs there is danger in betting the farm on an imminent collapse, since the pattern of trend indicates the Fat Lady won't sing until we see a final exhaustion run ... and the Canaries croak loudly, instead of singing.
For the moment, the most likely outcome is that any weakness which might develop over the next two weeks, will be replaced by another surge higher.
Safe trading - RA
(Disclaimer: This article is not advice or a recommendation to trade stocks; it is merely educational material.)


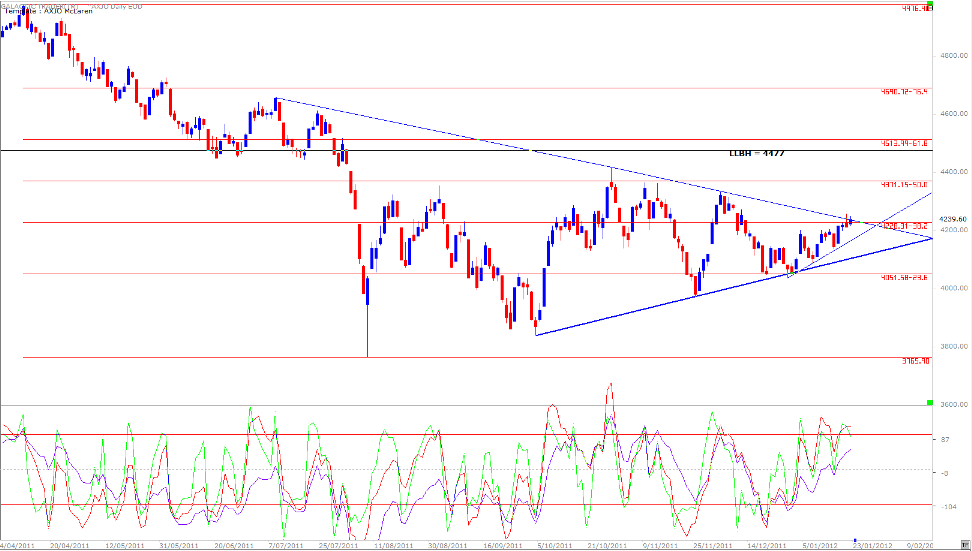
The 50% markers are playing very strongly with this index. The recovery from the 2009 Bear bottom stopped at a 50% retracement ... and so did the recovery from October's TAS (trading against spike) low.
She's back at a double stalling point - the intersection of the downtrend angle with the 382 Fibonacci Rx level. There is no really major disagreement here from any of the Canaries. There is small divergence from the 14, indicating a week or two of potential weakness, but both the very short-term green oscillator and the long-term purple one are singing the same song as the index itself.
She's back at a double stalling point - the intersection of the downtrend angle with the 382 Fibonacci Rx level. There is no really major disagreement here from any of the Canaries. There is small divergence from the 14, indicating a week or two of potential weakness, but both the very short-term green oscillator and the long-term purple one are singing the same song as the index itself.
