
The question is: 1360 ... or 1290 first?
Week beginning February 13, 2012
It's all about Venus. With a little bit of Saturn Rx. And the Sun shifting signs into woolly Pisces for a meeting with the newly-empowered Neptune.
Copyright: Randall Ashbourne - 2011-2012
As y'know, when Saturn decided to launch a coup against Uranus, he cut the old guy's ghoulies off and tossed them in the sea ... there was a bit of froth-and-bubble and up popped baby Venus ... who was then carried to shore by Neptune. It gave us the birth of Time (the Saturn takeover) and of fertility and beauty on the land when Venus stepped ashore. (And, yes, in yet another example of how the ancient Greeks knew more than they should ... Life on the land emerged from the oceans.)
I mentioned at the end of last weekend's edition that mood changes were arriving with the Venus sign shift to Aries and her face-off with Uranus. It continues this week when she squares Pluto. Now, as God of the Underworld, Ploots wasn't exactly the best-looking of the Old Gods. Nevertheless, he had the hots for cutie pie.
We've got a bit of natural tension here. If you'll allow me to be just a tad politically-incorrect, Venus in Aries is a lot more Ellen DeGeneris than she is Portia de Rossi. So, here's the gal who is, quite literally, the old weirdo's ghoulies face-to-face with de-knackered Uranus ... before moving on to a confrontation with an ugly, old lech who dribbles every time he sees her - and not necessarily from the mouth.
Well, would you be all sweetness and light in those circumstances?! Of course not. Now, in the symbolism of astrology, Venus is money ... Uranus is the quirky and unexpected ... and Pluto is Big Money, Really Big Debt and sovereign wealth.
Yes, dear reader. I'm going to have a little waffle about some of the Spooky Stuff before we get down to the mundane matters of technical talk.
Aww, c'mon. You can get the breathless analysis of Ben Bernanke's blatherings on CNBC.
Aww, c'mon. You can get the breathless analysis of Ben Bernanke's blatherings on CNBC.


In short, the problem with the PIIGS will pop and crackle again over the course of the next week.
There is also the problem of Saturn going into Retrograde motion last week. According to Ray Merriman, the best financial astrologer on the planet, markets have a well-timed habit of going into reverse when Ole Misery does ... and usually within 4 days.
It doesn't always work. But when, as we have, we're looking for a potential topping out, it's not something to be dismissed out-of-hand - especially when we have the princess of money translating the hard, square aspect between Uranus and Pluto.
As it happens, the Venusian meeting with the Dark Lord occurs with la Lune moving into Sagittarius. The Moon in Sadge often brings wide-range days. They can be mindlessly optimistic, or they can be the exact reverse, exacerbating the fear factor.
Next weekend, the Sun moves from Aquarius, the sign which has rulership of stock markets, into Pisces - where nothing is ever as it seems and any action tends to be confusing. Except, in this case, his very first aspect will be a conjunction with Neptune, now back in his home sign for the first time in about 165 years. If he's anything like the rest of us when he's been travelling for a while, Neppy is probably feeling pretty damn good about being home.
It's another key marker in this potential topping process. Last week, Pollyanna made her high right in line with the Venus conjunct Uranus aspect.
Okay, I think that's about enough of the Spooky Stuff. I'll remind y'all of the mantra ... astrological expectations do NOT override technical conditions. So, let's turn our attention to the latter, eh.
Now, last week we were discussing how the Friday rocket-booster launched the SP500 back into its exhaustion run. Later, when we come to the FTSE and the ASX, we'll see they weren't as Pollyanna-esque.
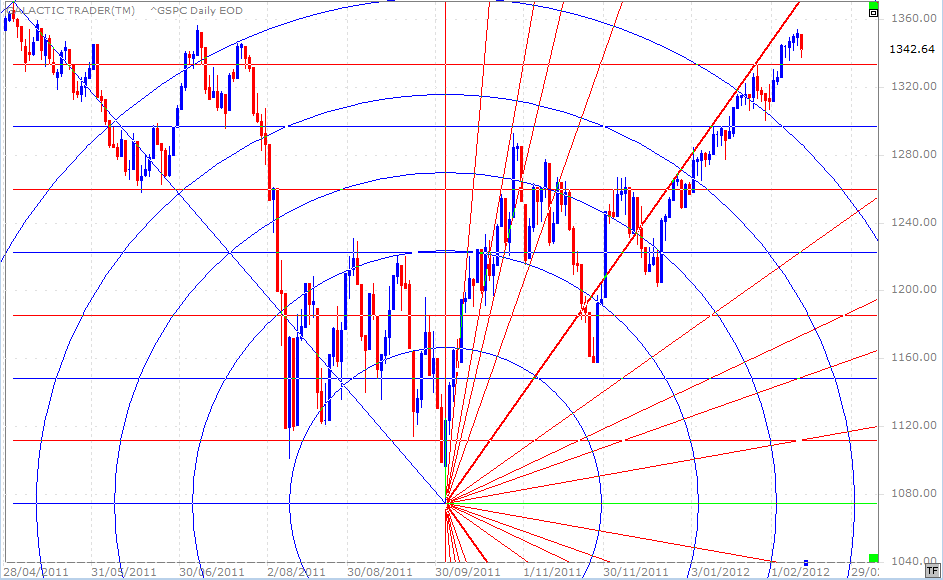
We had a 1st degree countertrend down when Price hit the intersection of a Gann price division with the primary Gann rally angle. Then we had the overnight intervention which catapulted Price through the upside barrier. You might remember that last weekend I refused to use the NYSE's official "data" ... cough, splutter, gag, puke ... and used the actual trading data which highlighted the manipulation of this index by the computers owned by the firms which own the US Federal Reserve.
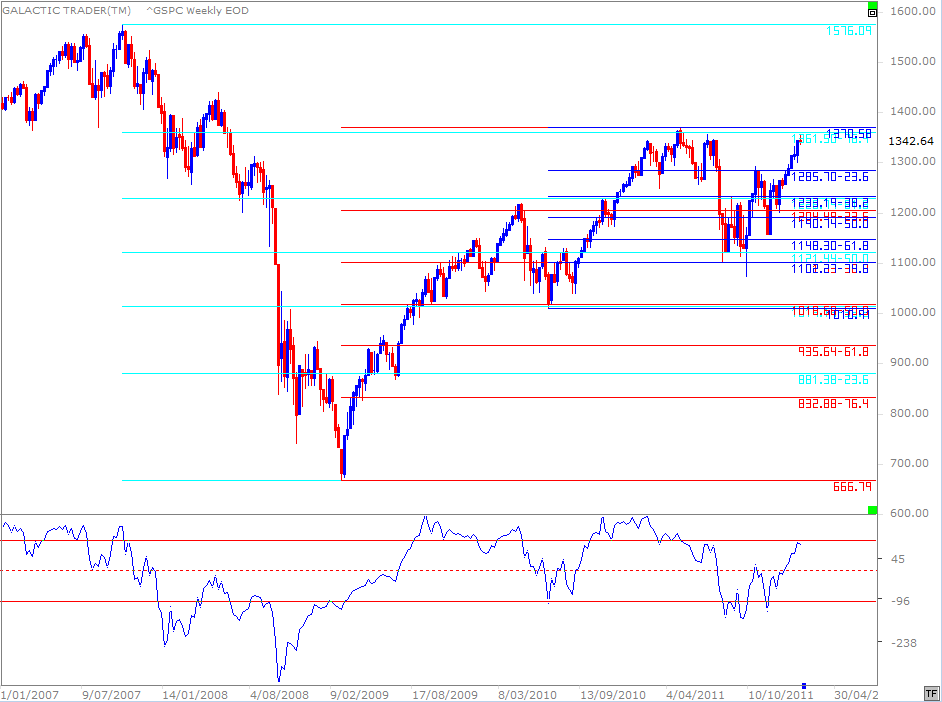
Blah, blah. What is interesting is that Price is beginning to lose contact with that primary Gann angle. And we can see why that might be by consulting Fibonacci levels on a weekly chart.
Let's not get hung-up over-analysing the detail. There are 3 sets of Fibs and there can be no doubt the geeks have entered the levels into their computer programs. The red covers the Rx levels of the 2009-2011 recovery rally; the dark blue covers the 2010-2011 upleg; and the cyan covers the Bear crash from 2007 into 2009.
We can see one of those levels in play just north of last week's action - 1361.50. It was broken marginally last year when the rally stopped out at the Last Low Before the High, which was something I discussed in The Eye last year, warning that it was likely to produce a strong reversal.
Now we have another run at breaking the barrier - but with our long-range Canary showing a potential turn south at its main upper barrier.
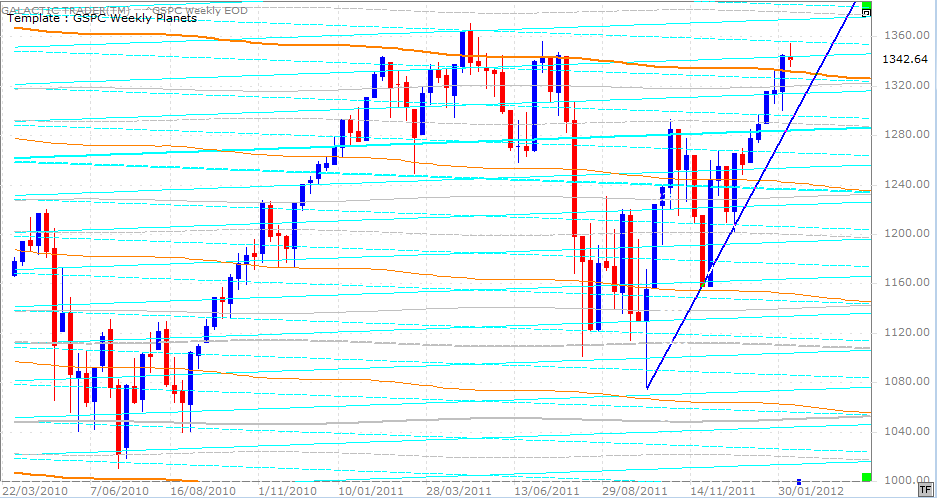
The chart above is Polly's Weekly Planets, though I've set the lines at closer degrees of the zodiac than I normally show. Before we get to the planetary price levels, however, note last week's candlestick. We haven't seen an indecision price bar quite like this one since last July, as Wall Street was about to go into a dive.
Still, the rally angle is not yet in danger and even if Price retreats below the orange Node, there's a strong Saturn in the 1280s.
Still, the rally angle is not yet in danger and even if Price retreats below the orange Node, there's a strong Saturn in the 1280s.
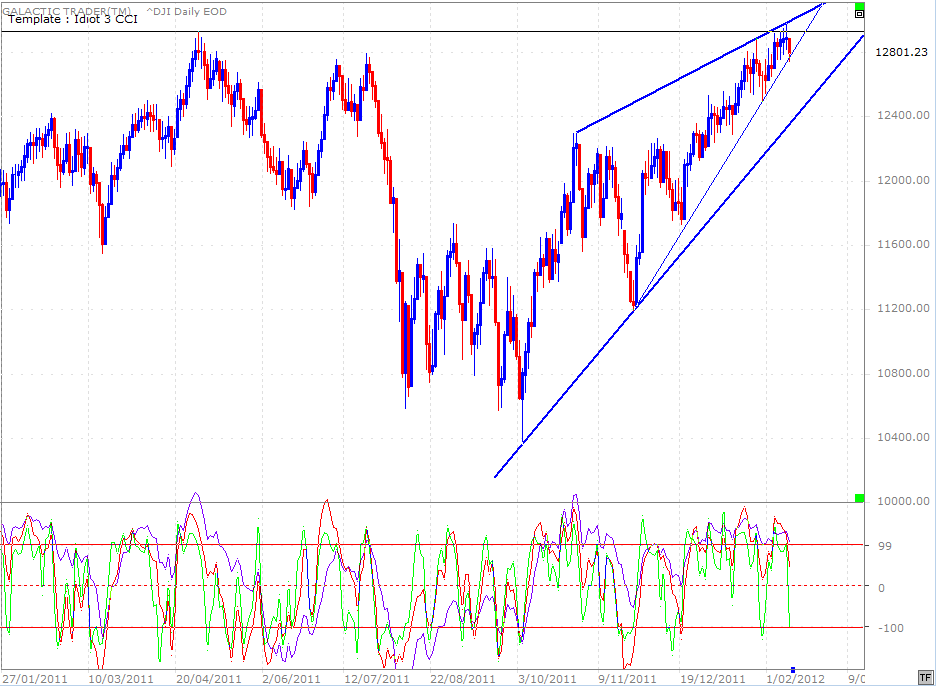
Though we are getting signs from the big index, the DJIA, that the rally may be starting to falter. So far, Price cannot hold above last year's high in the index and Friday's drop only just managed to close inside the fast-rally angle. It could be a pattern known as an ending diagonal, where the tops become shallower as the lows become steeper - and the result is usually a breakdown, rather than a breakout.
Last week's highs were not endorsed by the oscillator peaks, which are starting to diverge. But, we're dealing with a daily chart ... not something of potential intermediate or long range. And, of course, the geeks are as well-versed in these patterns as they are with Fibonacci levels and can manipulate even these into the dreaded "something else" if their masters haven't yet unloaded enough crap onto the suckers.
Last week's highs were not endorsed by the oscillator peaks, which are starting to diverge. But, we're dealing with a daily chart ... not something of potential intermediate or long range. And, of course, the geeks are as well-versed in these patterns as they are with Fibonacci levels and can manipulate even these into the dreaded "something else" if their masters haven't yet unloaded enough crap onto the suckers.
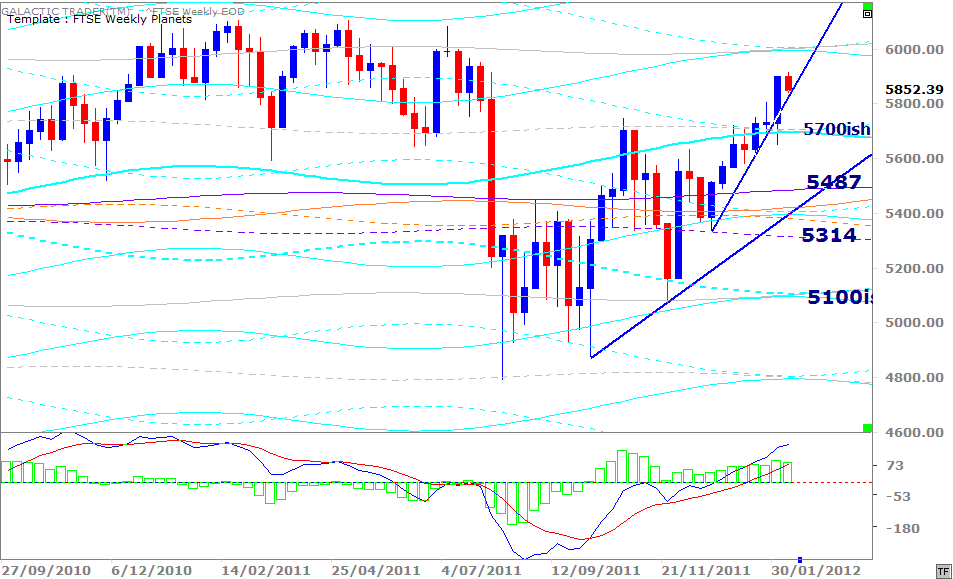
The Footsie's Weekly Planets chart, above, shows another challenge of the too far/too fast uptrend ... with building divergence in the MACD histograms, but none yet in the MACD signal lines.
In contrast to Wall Street and London, Australia's ASX200 has gone nowhere for the past couple of weeks ... and the weekly MACD signals are not showing anywhere near the same amount of strength.
I know! Don't worry ... the old bat is driving me up the wall, as well! So, here's a "cheat sheet" weekly to use in conjunction with Auntie's Weekly Planets chart above.
I know! Don't worry ... the old bat is driving me up the wall, as well! So, here's a "cheat sheet" weekly to use in conjunction with Auntie's Weekly Planets chart above.
Safe trading - RA
(Disclaimer: This article is not advice or a recommendation to trade stocks; it is merely educational material.)
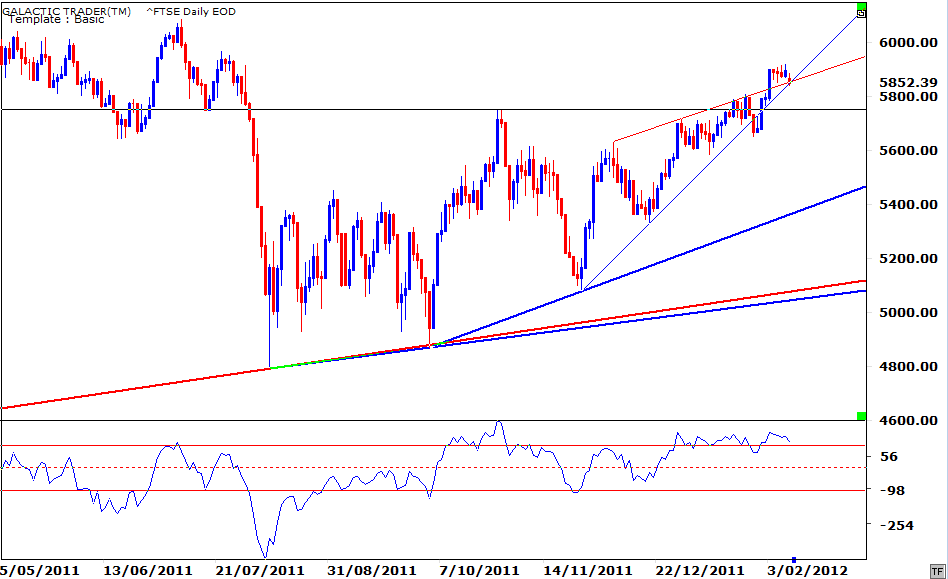
A false-break overshoot to the upside is not unusual with this pattern ... and that's something we might have seen already in London's FTSE index. Obviously, the coming week is make-or-break for the FTSE and it will be especially interesting to see how the index reacts at the horizontal black line.
You'll note that while Pollyanna and the Dow continued trying to push up last week, the FTSE had even more trouble holding the Opening price gains every day except Thursday.
You'll note that while Pollyanna and the Dow continued trying to push up last week, the FTSE had even more trouble holding the Opening price gains every day except Thursday.
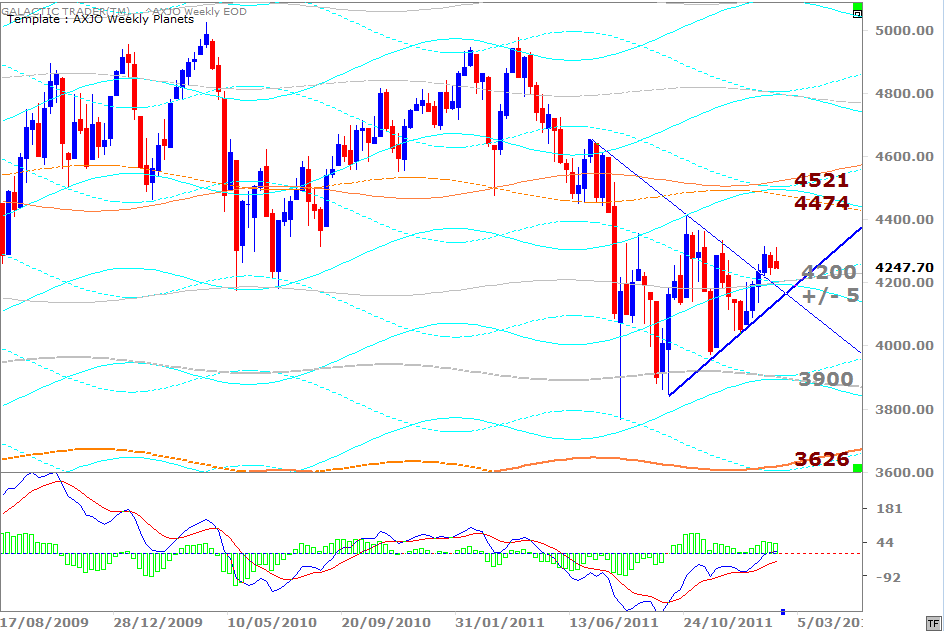
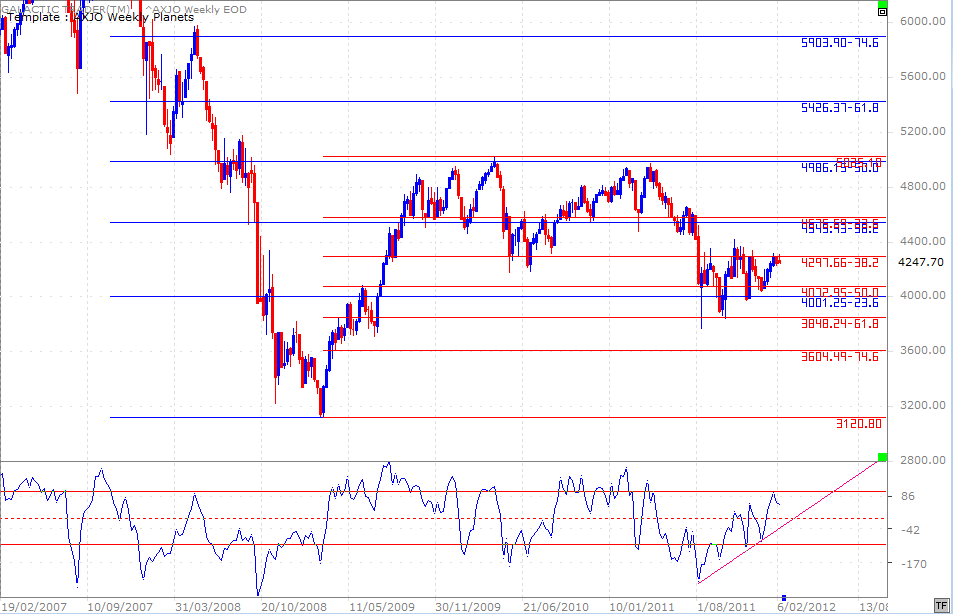
Basically, she's playing Fibolin strings and giving contradictory signals. The Canary suggests breakout, but both Price and the MACD don't support the view. Technically, this is either accumulation - or distribution at a disturbingly low level. Whichever one it eventually proves to be, it would be very inadvisable to stand in front of it crying: You're wrong, go back!
