
FTSE warns of planetary downdraft
Week beginning August 20, 2012
For the past couple of weekends, we've been mindful of the potential for markets to challenge previous Highs and, perhaps even breakout higher - especially going into last week's Venus and Mars aspects and the statistical high period of a New Moon.
Copyright: Randall Ashbourne - 2011-2012
We will review the charts this weekend for the 500, the Nasdaq 100, Germany's DAX and India's Nifty ... as well as analysing the potential for an important, sudden downdraft planetary signal now showing up on London's FTSE index.
The FTSE signal is the reverse of one which showed up in early June when I pointed out that index had a history of attaching itself to rising Sun lines as it entered rally mode.
In astrological terms over the next week, there is little to get excited about. The Sun will move from Leo to Virgo, suggesting a change in thinking. Leo, as one of the Fire signs, is optimistic to the point of being heroic. It's also the sign that rules gold, gambling and stock speculation.
Virgo is symbolic of a more reticent and more critical energy. It's one of the "thinking" signs, where almost nothing is taken at face value, but is closely analysed and dissected in detail. Virgo is the sign that rules accountants and knows how to check the books for any signs of flawed thinking and rubbery figures.
Wall Street ended last week with the VIX, the so-called fear index, at its lowest level since 2007 ... while the SP500 rose further within the bubble territory which culminated in the onset of major Bear attacks.


Safe trading - RA
(Disclaimer: This article is not advice or a recommendation to trade stocks; it is merely educational material.)
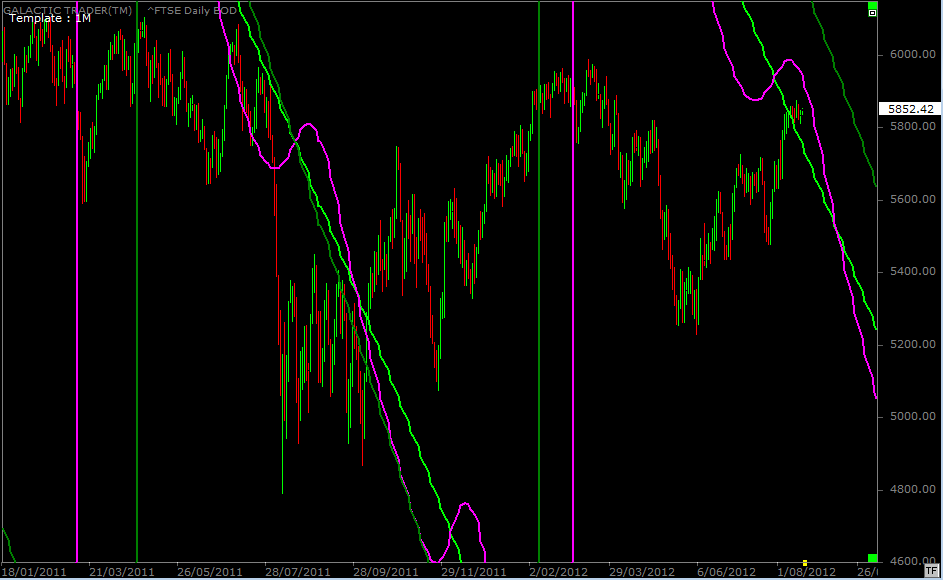
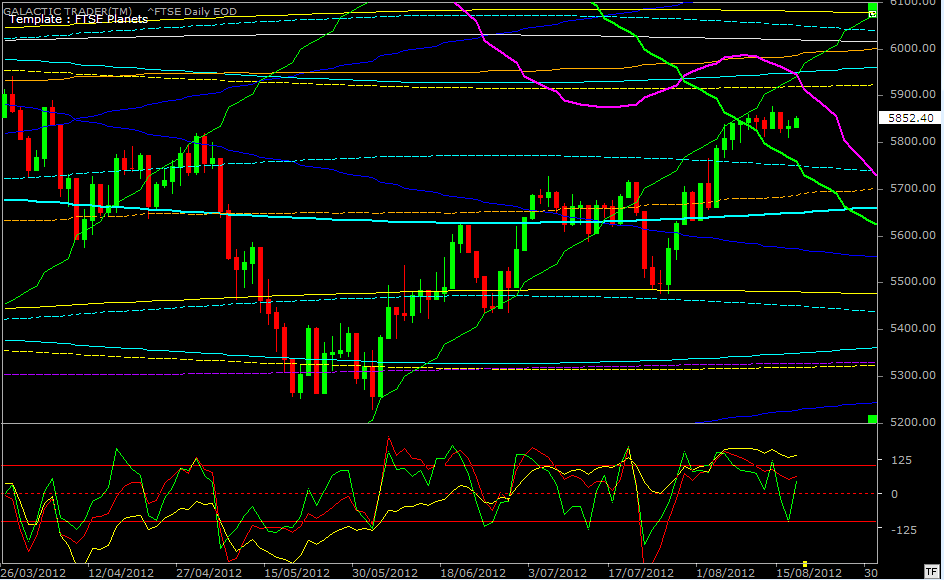
I indicated recently the index was trying to reattach itself to that rising Sun line, but that I thought the attempt would fail. For the most part, the index has simply gone sideways since then ... and is now within a Sun/Mercury downtrend zone, in a very similar position to where it was going into mid 2011.
The oscillators are stacked negatively. Green is the short-term, red the medium, and the yellow line is the long-range. There is no confirmed danger to the rally until that yellow line breaks down below the top red horizontal in the indicator panel. However, the other two are warning internal weakness is developing.
In spite of those warning signs, we cannot rule out more upside in the FTSE
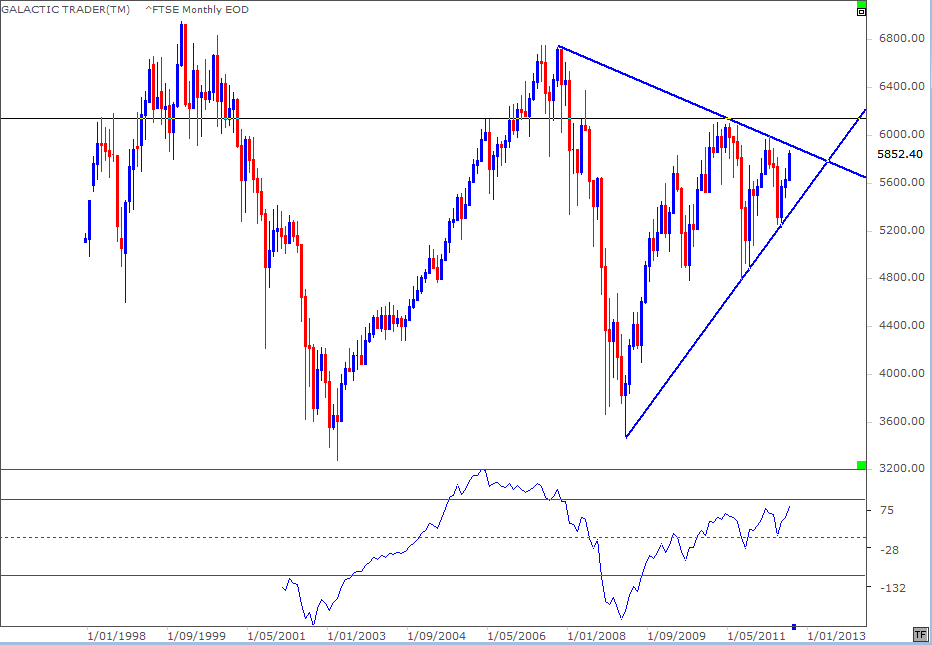
The chart above is a FTSE monthly and perhaps the most significant thing on the chart is not the index's containment within a triangle, but the fact that the long-range Canary is showing a sign of positive divergence. It is not confirmed, because the month is only half over.
The oscillator is currently hitting a higher peak, while price is actually lower than the two previous peaks. So, from a technical reading, the monthly is suggesting higher prices are probable. Balanced against that is a planetary price warning with some historical validity.
As a more general comment ... unlike some of the American indices, the FTSE has backed away from "the bubble zone" delineated by the black horizontal and has yet to take out either its highs from early 2011 or early 2012.
Germany's DAX is in a similar position.
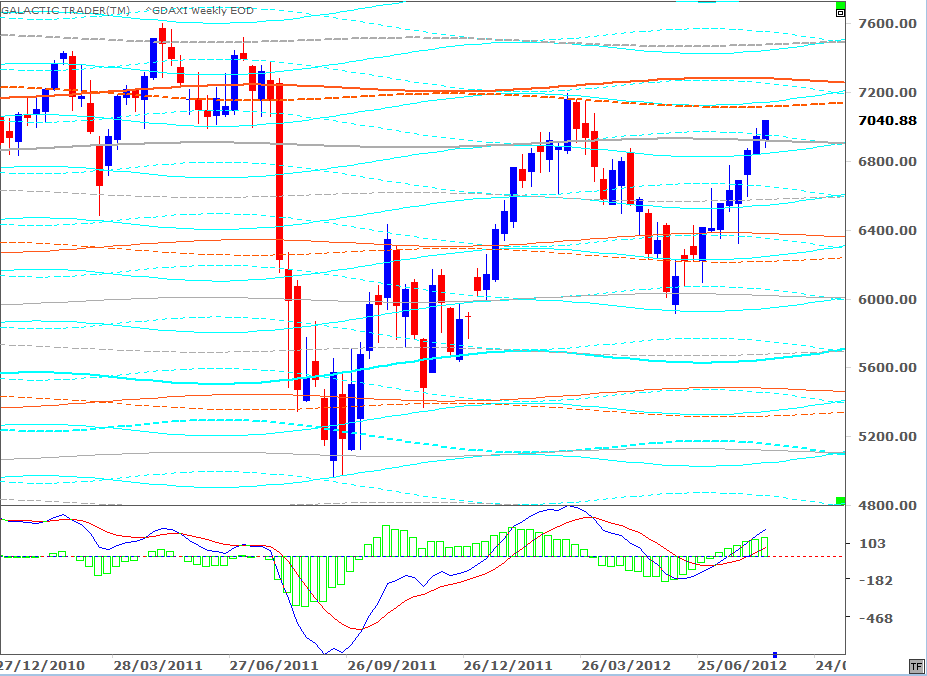
As we've discussed recently for the 500, the FTSE and the ASX 200, there have been no warning signals emanating from the fast MACD on weekly charts - and the same is true for the DAX, where the rally is endorsed not just by the rising, positive signal lines, but also by the continued climbing of the histogram peaks.
Above is the DAX Weekly Planet chart - and it would appear as though the index is trying to reach Uranus targets, the orange lines which provided both Support and Resistance as the index was topping in early 2011. The price levels associated with those lines are 7117 and 7279.
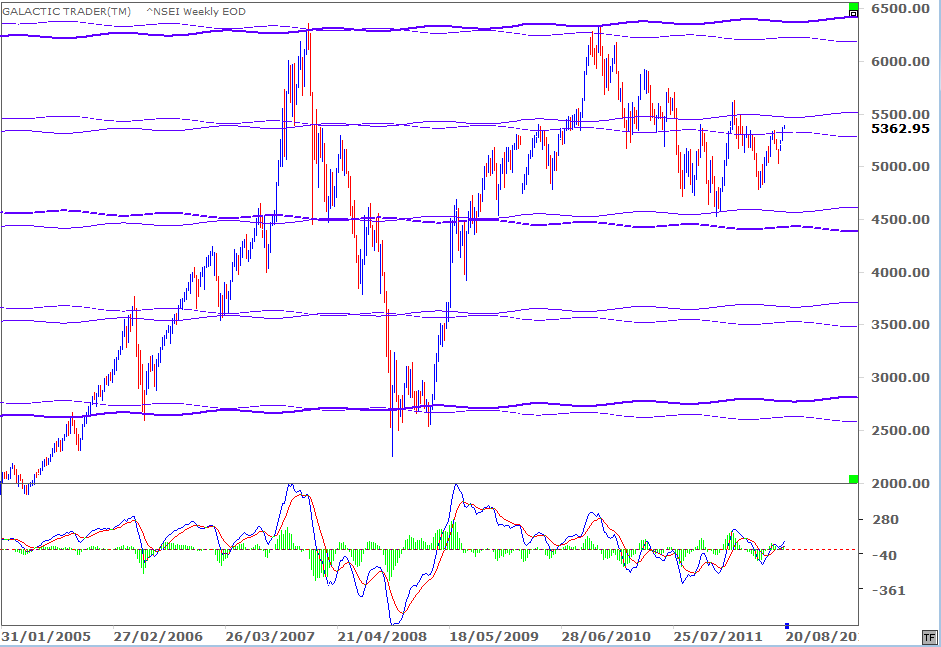
Let's look next at India's Nifty 50 index. I draw your attention firstly to the fact it's largely a Pluto dominated index. As is easy to see from its history, the Nifty tends to find either long-range Support or Resistance at price levels determined by the position of Pluto in the zodiac.
We will begin this week by looking at the potential warning signal from the FTSE.
That gives us a guide to where the Nifty might be aiming before the current rally starts to fail. We can use the Nifty Weekly Planets chart, below, to see what's happening.
Please ignore the vertical pink and green lines - some sort of software glitch. What we're interested in are the two sets of downtrending diagonals. These are primary Sun, Mercury and Venus lines ... and are what sent the FTSE into a dive when the index bumped into them just over a year ago.
Below is the FTSE Planets chart we've constantly revisited since early June, when the rising green diagonal of a Sun line first alerted us to the potential for a rally in Western stock indices.
Below is the FTSE Planets chart we've constantly revisited since early June, when the rising green diagonal of a Sun line first alerted us to the potential for a rally in Western stock indices.
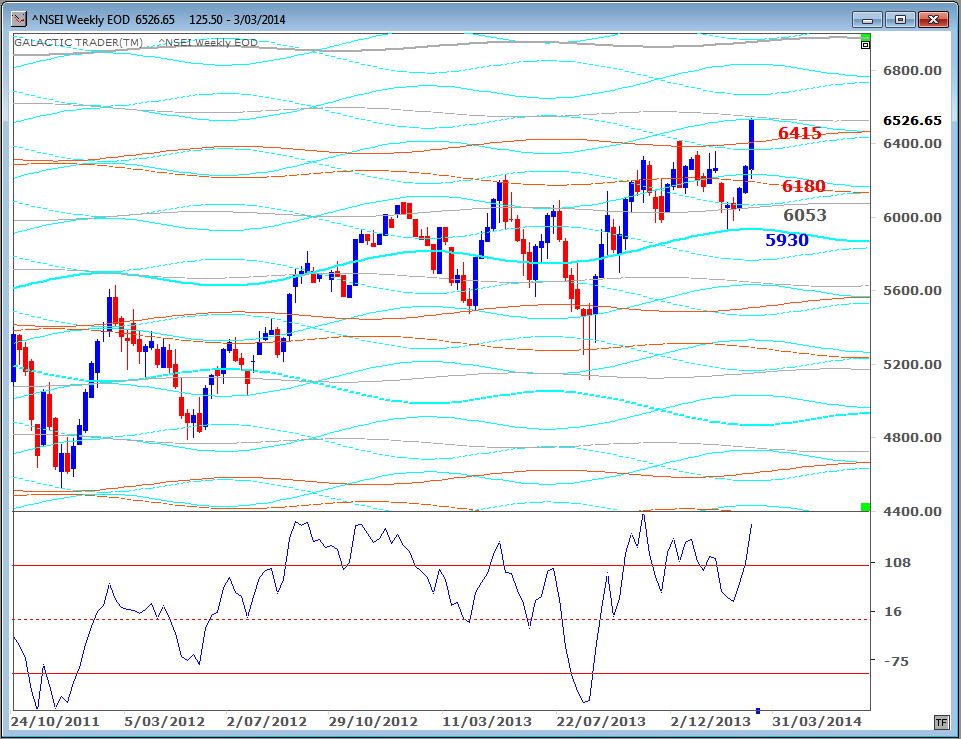
The index ended the past week sitting on top of the Pluto line it backed down from six weeks ago. If you trace that line backwards across the chart, you can judge its past significance. Obviously, if the Nifty can hold the 5322 level, the weekly target is 5473 before it faces rejection by the overhead Pluto.
Okay, so let's head over to Wall Street. We'll begin with a long-range look at the NDX so we can see the big picture.
Okay, so let's head over to Wall Street. We'll begin with a long-range look at the NDX so we can see the big picture.
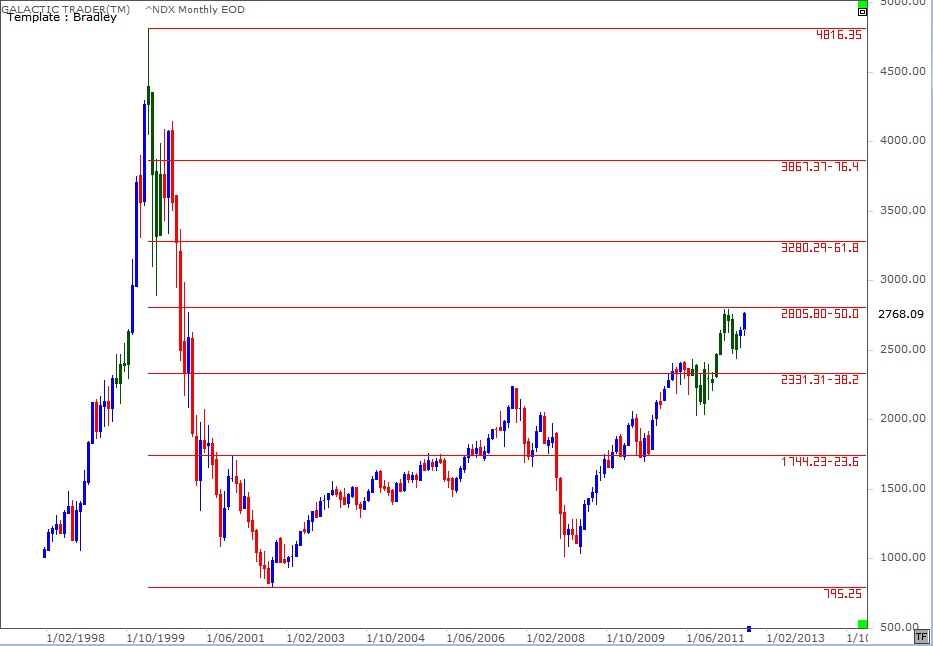
Firstly, the dark green price bars show the time Jupiter was in Taurus - historically, the Bull peak before a Bear decline which lasts until Jupiter in Leo. The tech bubble-become-wreck peaked with Jupiter in Taurus. It, so far, appears to be doing a repeat performance ... a minor case of the wobbles as Jupiter first goes green ... followed by a sudden rally and fast drop ... then a retest of the Taurean Jupiter high.
In this case, the retest is also an important Fibonacci level. So, while the performance of Nasdaq stocks, like Apple, has been of real importance in lifting Wall Street, there are reasons to be concerned about the potential for much higher gains.
Now that we have some idea of what other major markets are doing, let's try to read the omens, portents and entrails for Pollyanna, the SP500.
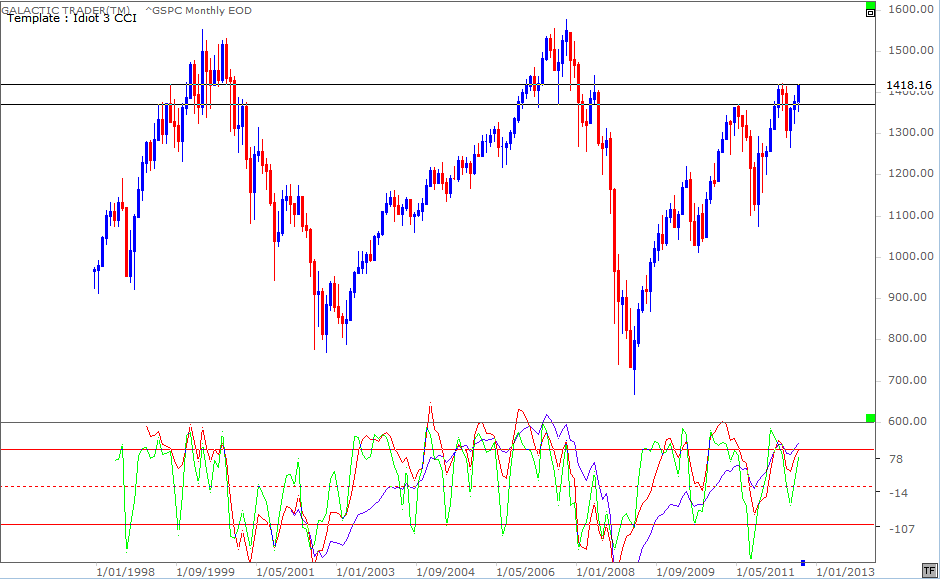
Let's begin with another look at the long-range. I'm still at a loss to explain why anyone would be expecting further Fed intervention with the major Wall Street indices at these price levels. The horizontal technical Resistance is obvious at this level. Pollyanna is well inside the bubble zone - and there are warning klaxons going off in both the short-term and medium oscillators.
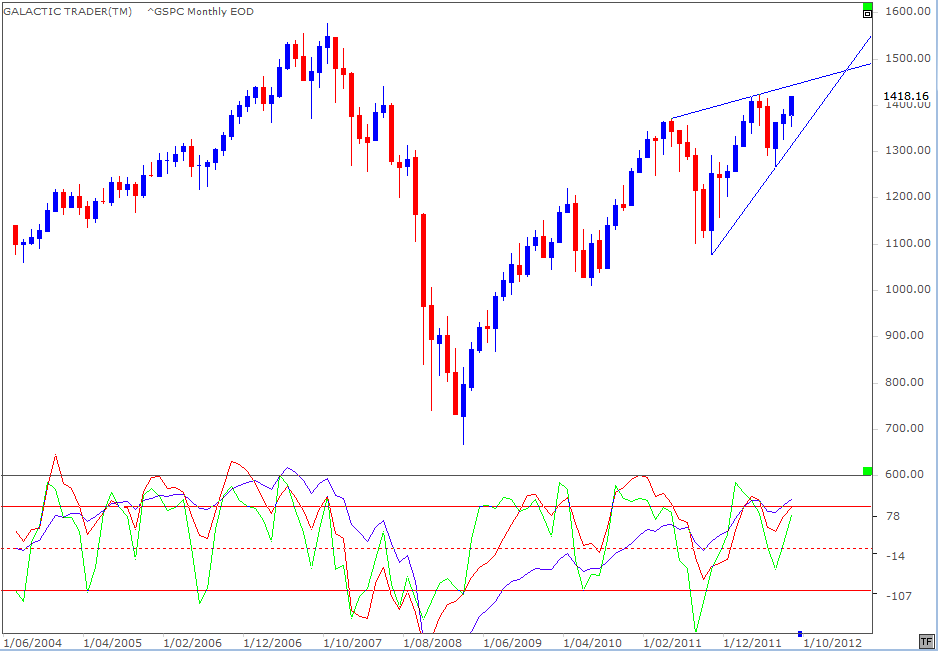
The warnings don't rule out the possibility - even the probability - of a new high before markets roll over, since the pattern appears to be that of an ending diagonal, which would allow for a marginal new high in the post-2009 recovery rally before a decline begins.
Again I point out that these oscillator signals do not become confirmed until the month is over. It is possible we could get a new high here, but that by the end of the month the long-range Canary will display negative divergence, just as the short-term and medium lines are currently showing.
Again I point out that these oscillator signals do not become confirmed until the month is over. It is possible we could get a new high here, but that by the end of the month the long-range Canary will display negative divergence, just as the short-term and medium lines are currently showing.
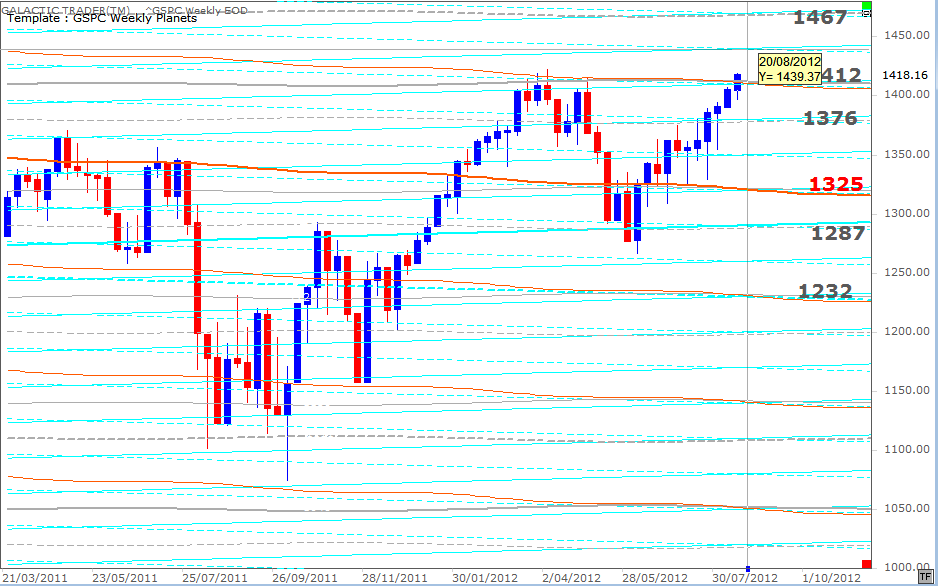
Last weekend, we discussed the potential for a breakout heading into the Venus/Mars aspects to Saturn and Uranus/Pluto and the New Moon ... and we got the highest, strongest weekly close in the index since the start of the Bear market in 2007.
IF the rally is to continue, there are two different target levels. The 1467 has been marked on the long-range and weekly planets charts for Pollyanna for some time. The interim level is marked by the crosshair cursor on the chart above - 1439.
Also over the past couple of weeks, I've been using Bi-BB charts for various indices as an example of how useful a tool it can be, for those of you who've absorbed that chapter from The Technical Section. It's a valuable technical tool which can be set up in almost any market software and gives slightly different alternative targets to the planetary charts.
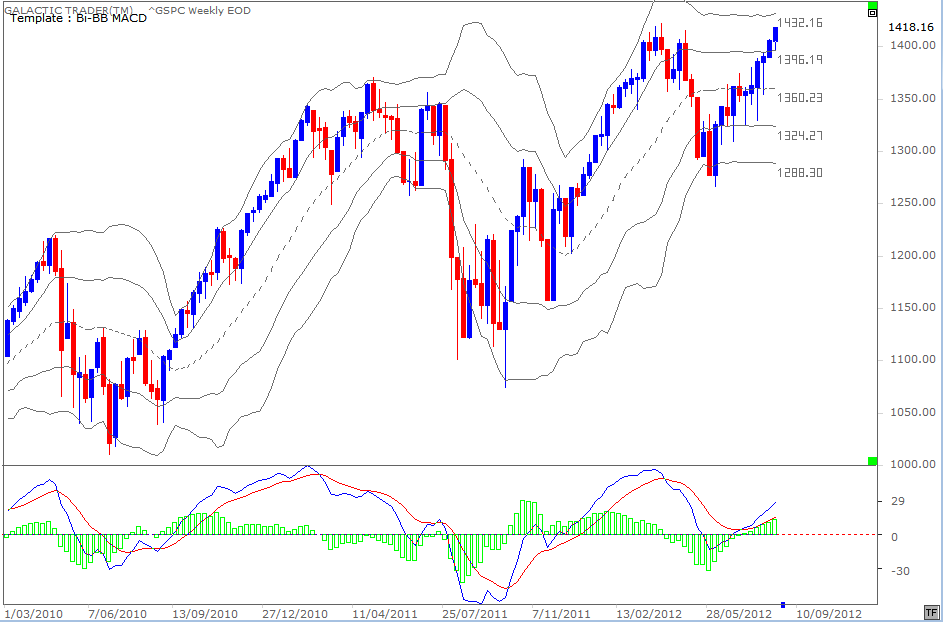
The index behaved as it's "supposed" to do after breaking into the top tier of the Bi-BB layers at the end of the previous week; retesting downside support and then bouncing higher. There is still no warning signal from the fast MACD, with the signal lines and the height of the histogram peaks endorsing the legitimacy of the rally.
There is a chance the breakout on Pollyanna is a "false break", which would bring on a collapse. But there are no really major warning signs of that danger.
The only danger signal is coming from the FTSE. Months ago, we used the appearance of a rising Sun line to alert us to the potential for a rebound in Western markets. Now, those charts are sending an alert that a sudden and unexpected downdraft may be nearby.
