High-energy aspects will hit mid-week
Week beginning August 13, 2012
Stock markets are due for a date with destiny this coming week with a high chance of breakout ... or breakdown.
Copyright: Randall Ashbourne - 2011-2012
Instead, they continued a slower grind higher. It was an outcome we anticipated last weekend - largely because of the state of the oscillators on weekly charts for the SP500, the FTSE and the ASX200. I remarked:
"So, we have a situation where the normal Mercury Rx mode should bring prices down again by midweek, but the technical picture across three indices points towards further intermediate gains and the potential for a retest of last year's Highs."
In the coming week, there are high-energy aspects involving Venus, Mars, Saturn, Uranus and Pluto likely to provoke a sudden and significant shift.
And there's a New Moon, which leans towards a statistical high.
More significant, though, is a Mars conjunction with Saturn.
Mercury's return to Direct motion last weekend did bring a stop to the spurt-and-reverse cycle.
However, markets did not follow the pattern of ending the Mercury Retrograde period with prices near to where they were when the Rx cycle started.
However, markets did not follow the pattern of ending the Mercury Retrograde period with prices near to where they were when the Rx cycle started.


Safe trading - RA
(Disclaimer: This article is not advice or a recommendation to trade stocks; it is merely educational material.)
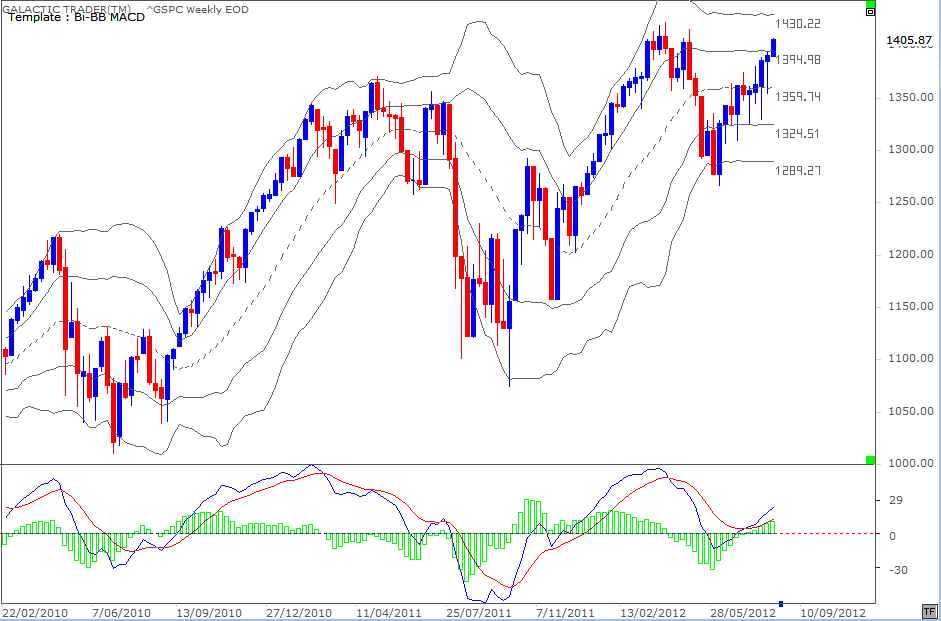
Last week's end of the spurt-and-reverse cycle did push price higher - back into the highest tier of the Bi-BB layers, and with no faltering of the fast MACD signals.
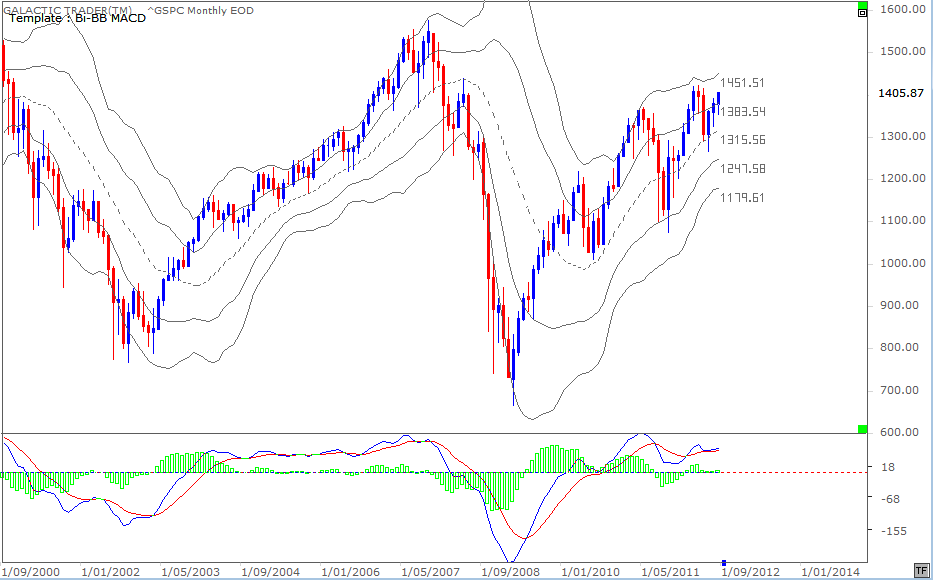
The bad news for the Bearish expectations can also be found in a monthly version.
The bad news for the Bearish expectations can also be found in a monthly version.
The primary difference between the weekly and monthly Bi-BBs for the 500 is the relative state of the fast MACD. On the monthly, each price peak has brought a significantly lower peak in the height of the histograms and continuing weakness in the state of the signal lines.
However, the recovery of the upper tier on both charts certainly points to the potential for a breakout above the highs of early this year before markets roll over for another Bear phase.
I used weekly and long-range planet price charts for the three indices last weekend and you can consult the price levels in the Archives if you need to, since we'll concentrate on technical charts this weekend.
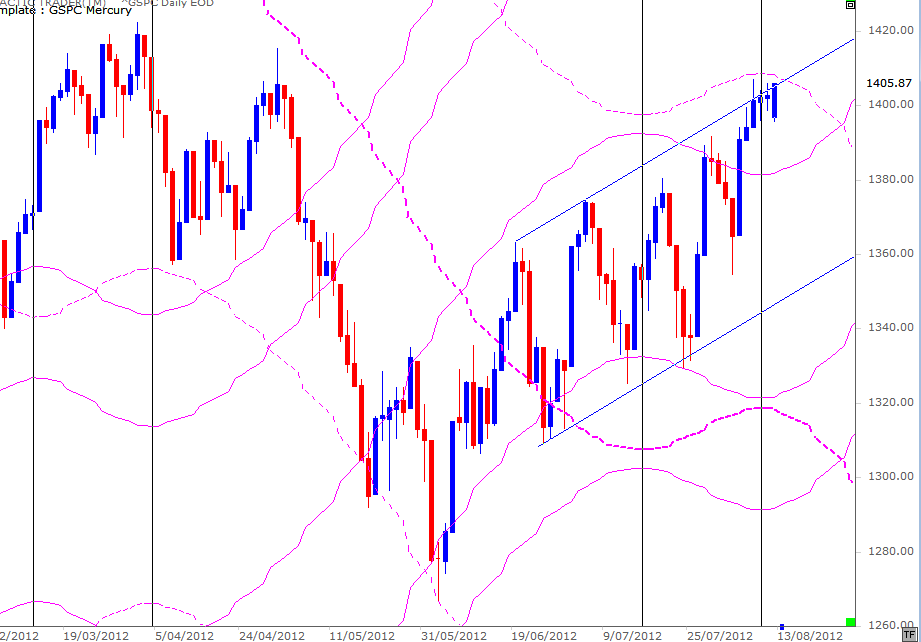
I should, though, show you what happened with the Mercury Rx cycle. The last two of them are marked with the black verticals. We know from Pollyanna's long-range planetary price chart that there's a strong barrier around 1413 ... I pointed out a couple of weeks ago the index has a habit of travelling within Mercurial corridors (the pink lines on the chart above) and last week's prices were contained by a Mercury line.
And price is also knocking its head against an overhead trend channel line.
So, breakout to higher prices does seem unlikely. It's not something we'd expect. However, the technical conditions of the two Bi-BB charts highlight the potential for the unexpected and unlikely to actually occur - and give price targets if it does occur.
In astrological symbolism, Mars is energy and drive. If you want a feeling for how Mars works ... it's a bunch of NASA boys pumping the air with their fists as they parachute a 1 ton dune buggy onto the surface of a distant planet so they can go hooning around in a hot rod on the pretext of discovering the meaning of life.
Saturn is the brick wall. A very solid, very reinforced brick wall. Symbolically, on Wednesday, the "drive" is about to hit a brick wall. At the same time, Venus will oppose Pluto and square Uranus.
Venus, as the ruler of both Taurus and Libra, symbolises the "value" of things. In Taurean mode, the value relates to material things; while in Libra, the value relates to the "worth" one puts on close "others" - a partner, good friends ... even enemies.
So, the value of material things - money in the form of currency and stock values - goes into open conflict (the opposition) with big debt and government intervention (Pluto in Capricorn) and challenges the status quo (Uranus in Aries).
In a nutshell, we have energy now in play which can force a breakout to unexpected highs ... or a complete breakdown. One would expect the latter course.
However, I continually stress the need to make a clear distinction between astrological expectations and technical conditions. It's why last weekend we spent some time looking at intermediate and long-range charts for potential upside barriers, even though the Bradley Model and my own Forecast predictions pointed strongly towards Bear mode.
This weekend, we will go through the exercise again, especially since the Venus and Mars transits are likely to provoke a strong move in one direction or the other.
We'll begin by revisiting a chart which has been used quite a few times in the past few months.
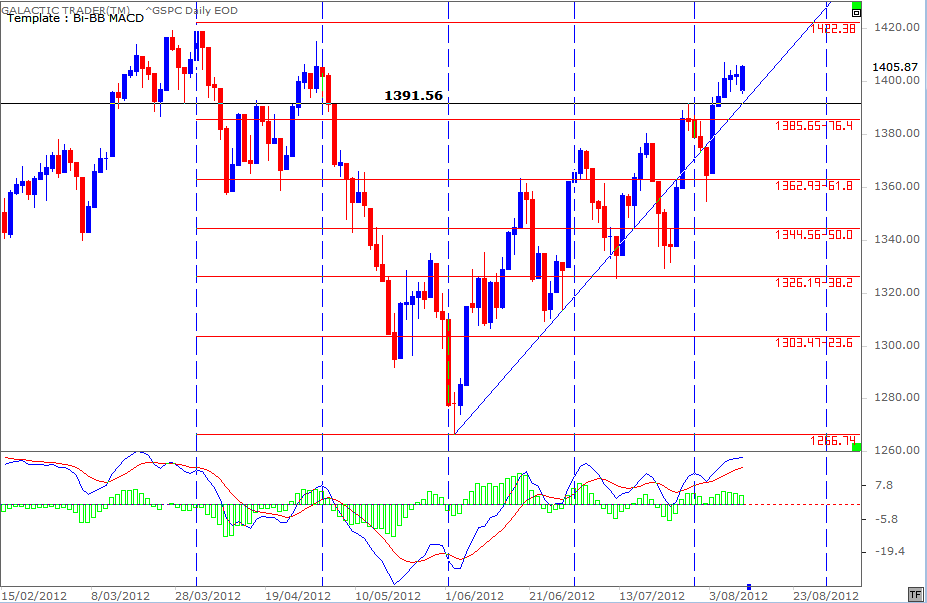
That potential is also endorsed by another version of a 500 daily chart. I've been chatting recently about the tendency of this index to run in 30 calendar day cycles once a trend enters cyclical mode. Allowing just a little leniency, we had - starting from the left - a 30 day high-to-high; a 60-day high-to-low; and then two highs coming in on the next 30 and 60 day markers, leaving the possibility that this rally from the early June low could run out to a total of 90 days.
We also discussed the importance of the 1391 level and how it would be rejected strongly on the first hit of that "last low before the high" price.
However, just as with the long-range chart earlier and the breaking of the 1370 August 2007 spike down price, a decisive second penetration of the barrier opens up a stronger chance of challenging the old highs.
There's not much point in going over the same ground with other indices this weekend. Breakout seems illogical; more central bank goosing of the stock markets at these levels seems mad beyond belief. These price levels were deemed to be irrational when times were good. At a time of massive and still-growing debt, unemployment levels at critical highs, and banks facing the risk of collapse, it's a party that should end badly. Very badly.
The reality check could arrive this week with the Venus and Mars aspects.
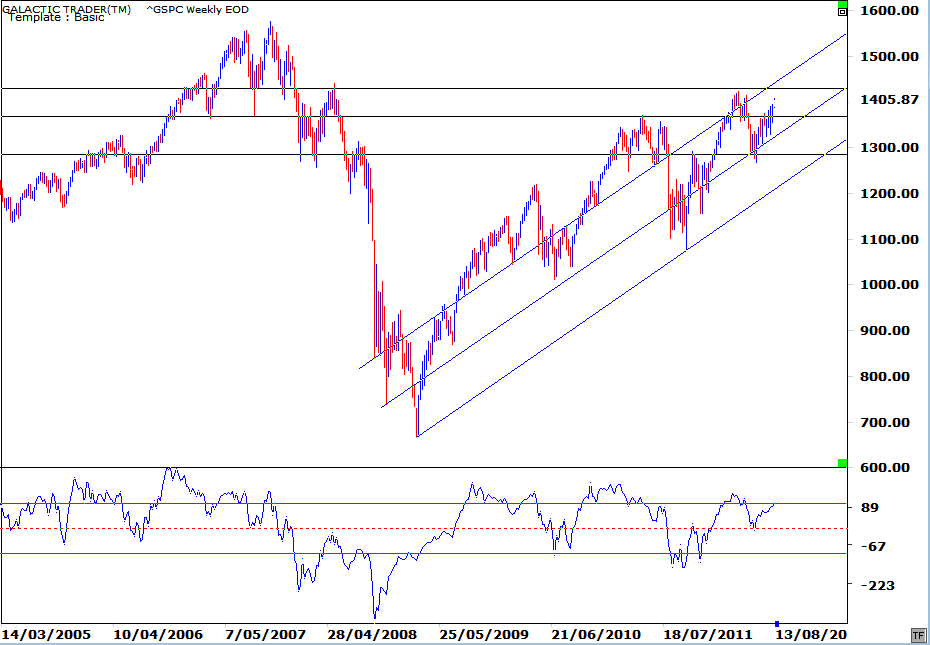
For quite a long time, I maintained only two black horizontal lines on this chart - with the upper line at the 1370 level. Firstly, a statement of the obvious ... the SP500 is still in a multi-year uptrend, riding the diagonal blue channels. It has broken above the 1370 level, which was the large spike down which provided the last low before the high and collapse in late 2007.
I've now added a third black horizontal and quick reference to past prices, indicates it's a very important marker. I also draw your attention to the state of the long-range Canary. Its current peak is lagging behind the price action. It means if we get a higher high, or even a double-top, and that negative divergence display continues in the oscillator, markets are finally set up - technically - to go into freefall. The technical set-up is what has been missing all year ... what I've described a number of times as the elephant in the room, trumpeting the real potential for higher prices than the astrological predictions expected.
Our next chart is Pollyanna's weekly Bi-BB. When I used this chart last weekend, I said: "On a technical basis, the chart suggests a new High is probable, rather than merely possible. The fast MACD looks healthy enough ... and the candlesticks are leaving long tails, indicating Bullish buyers step in just as the Bearish crowd threatens to take command."
